It is finally here. In addition to my work duties, it took me an incredibly long time to finish writing this blog. Personally, I was really looking forward to it because our mini series on cars is extremely popular among our clients.
I would like to thank all 1228 respondents from Slovakia (958) and Poland (270) for taking their time to complete the survey. This sufficiently representative sample enabled me to work with the data.
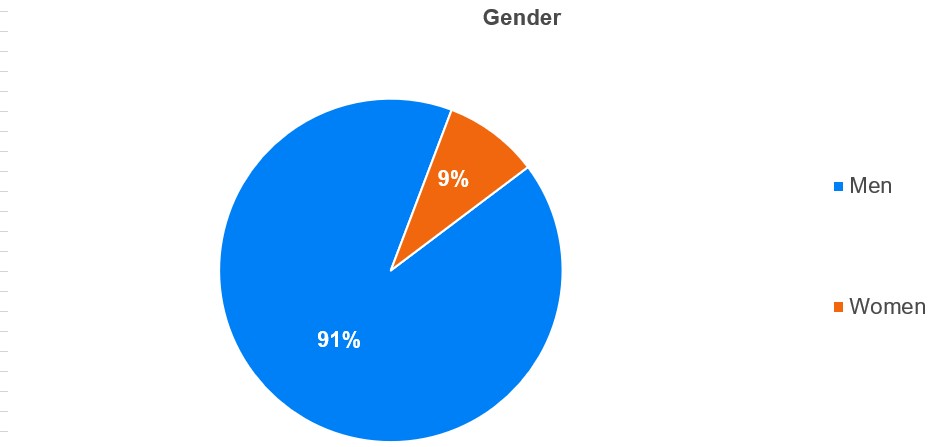
The survey was filled out predominantly by men. This topic interest them more. It is also the case in my family where the tasks are divided in such a way that taking care of car is part of my duties. However, I think only of the car as a means of transportation. I expect the car to get me reliably and safely from point A to point B, while also carrying the required number of passengers and cargo.
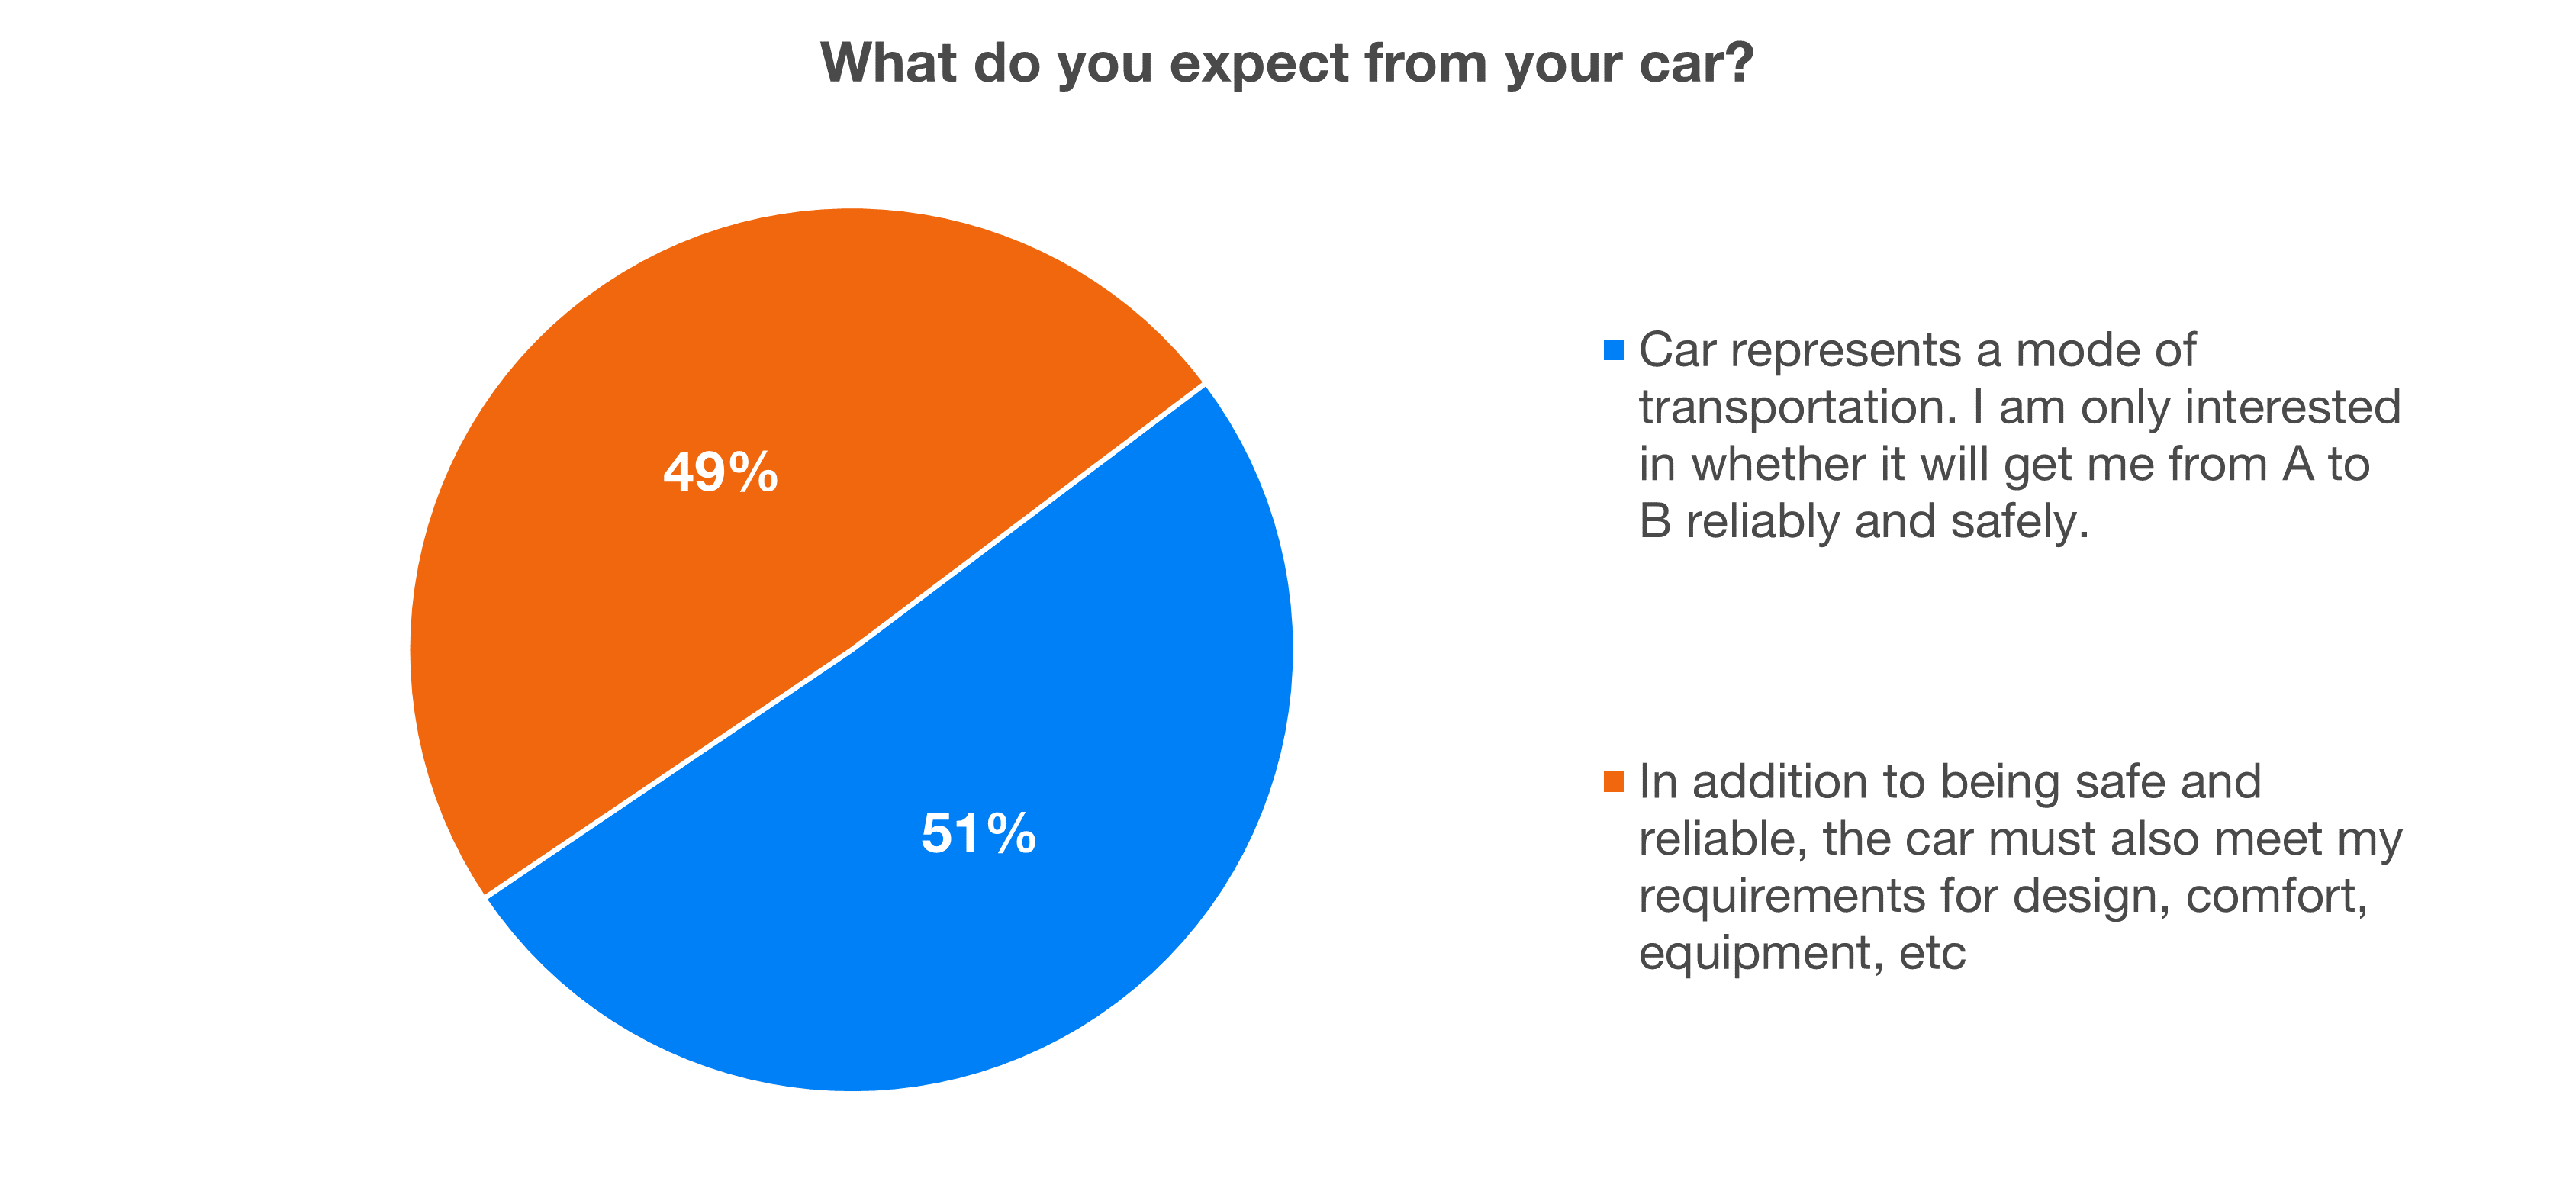
51% of our respondents have the same expectations as me, but for the other half of you, design, comfort and equipment play an important role.
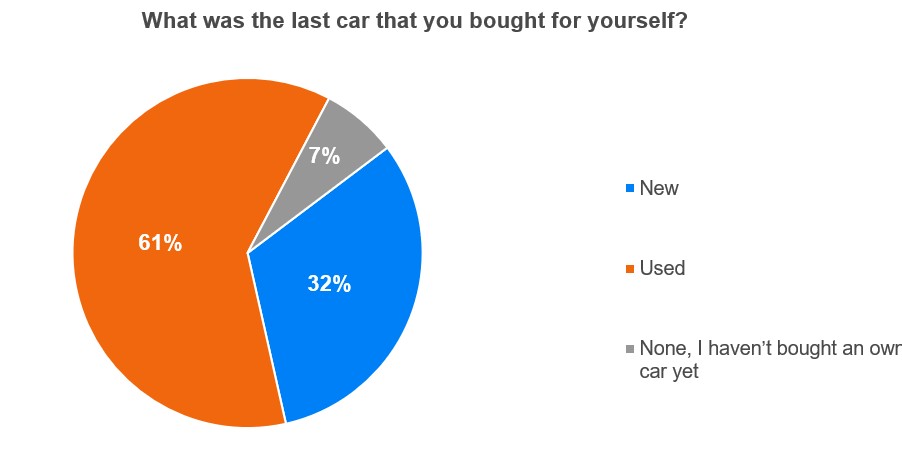
I was positively surprised that more than 60% of respondents (mostly Finax clients) had bought a used car. Of those who own a car, it represents two thirds. As I mentioned already, most of the respondents are our clients.
Due to the nature of our business, the average income of our clients is significantly above the Slovak average. Therefore, I believe that among our clients, there are hundreds of responsible people who decided to purchase a used car as a way of saving money.
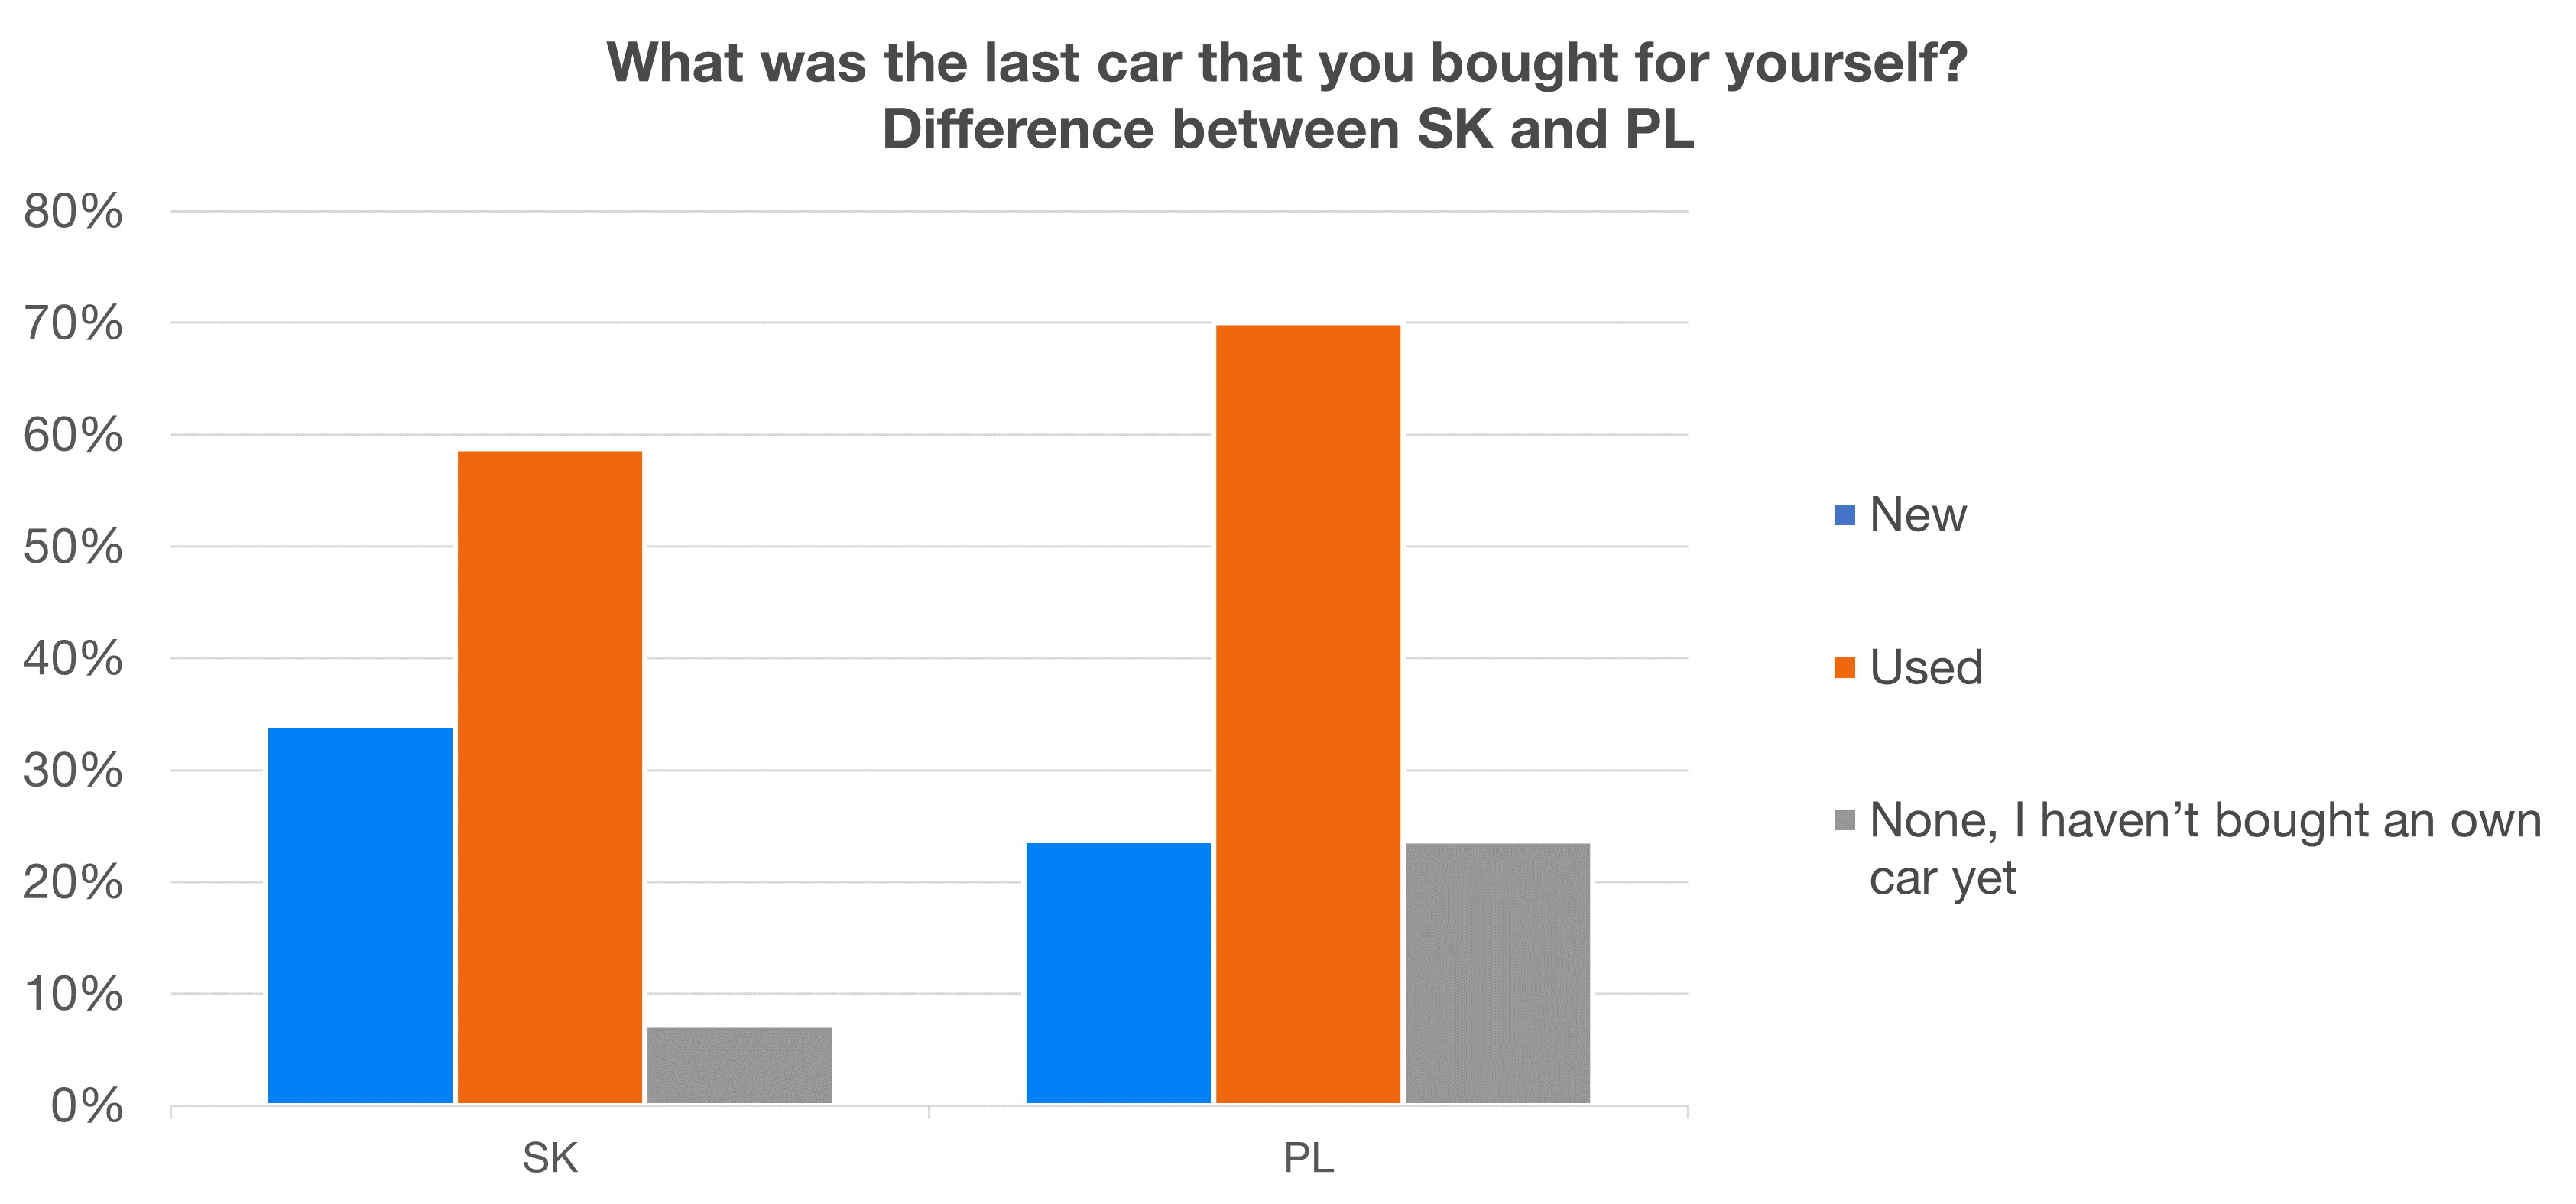
There is also a slight difference between Slovak and Polish respondents, with Poles having more used/no cars compared to number of new cars. However, this is also due to the demographic profile of our Polish clients.
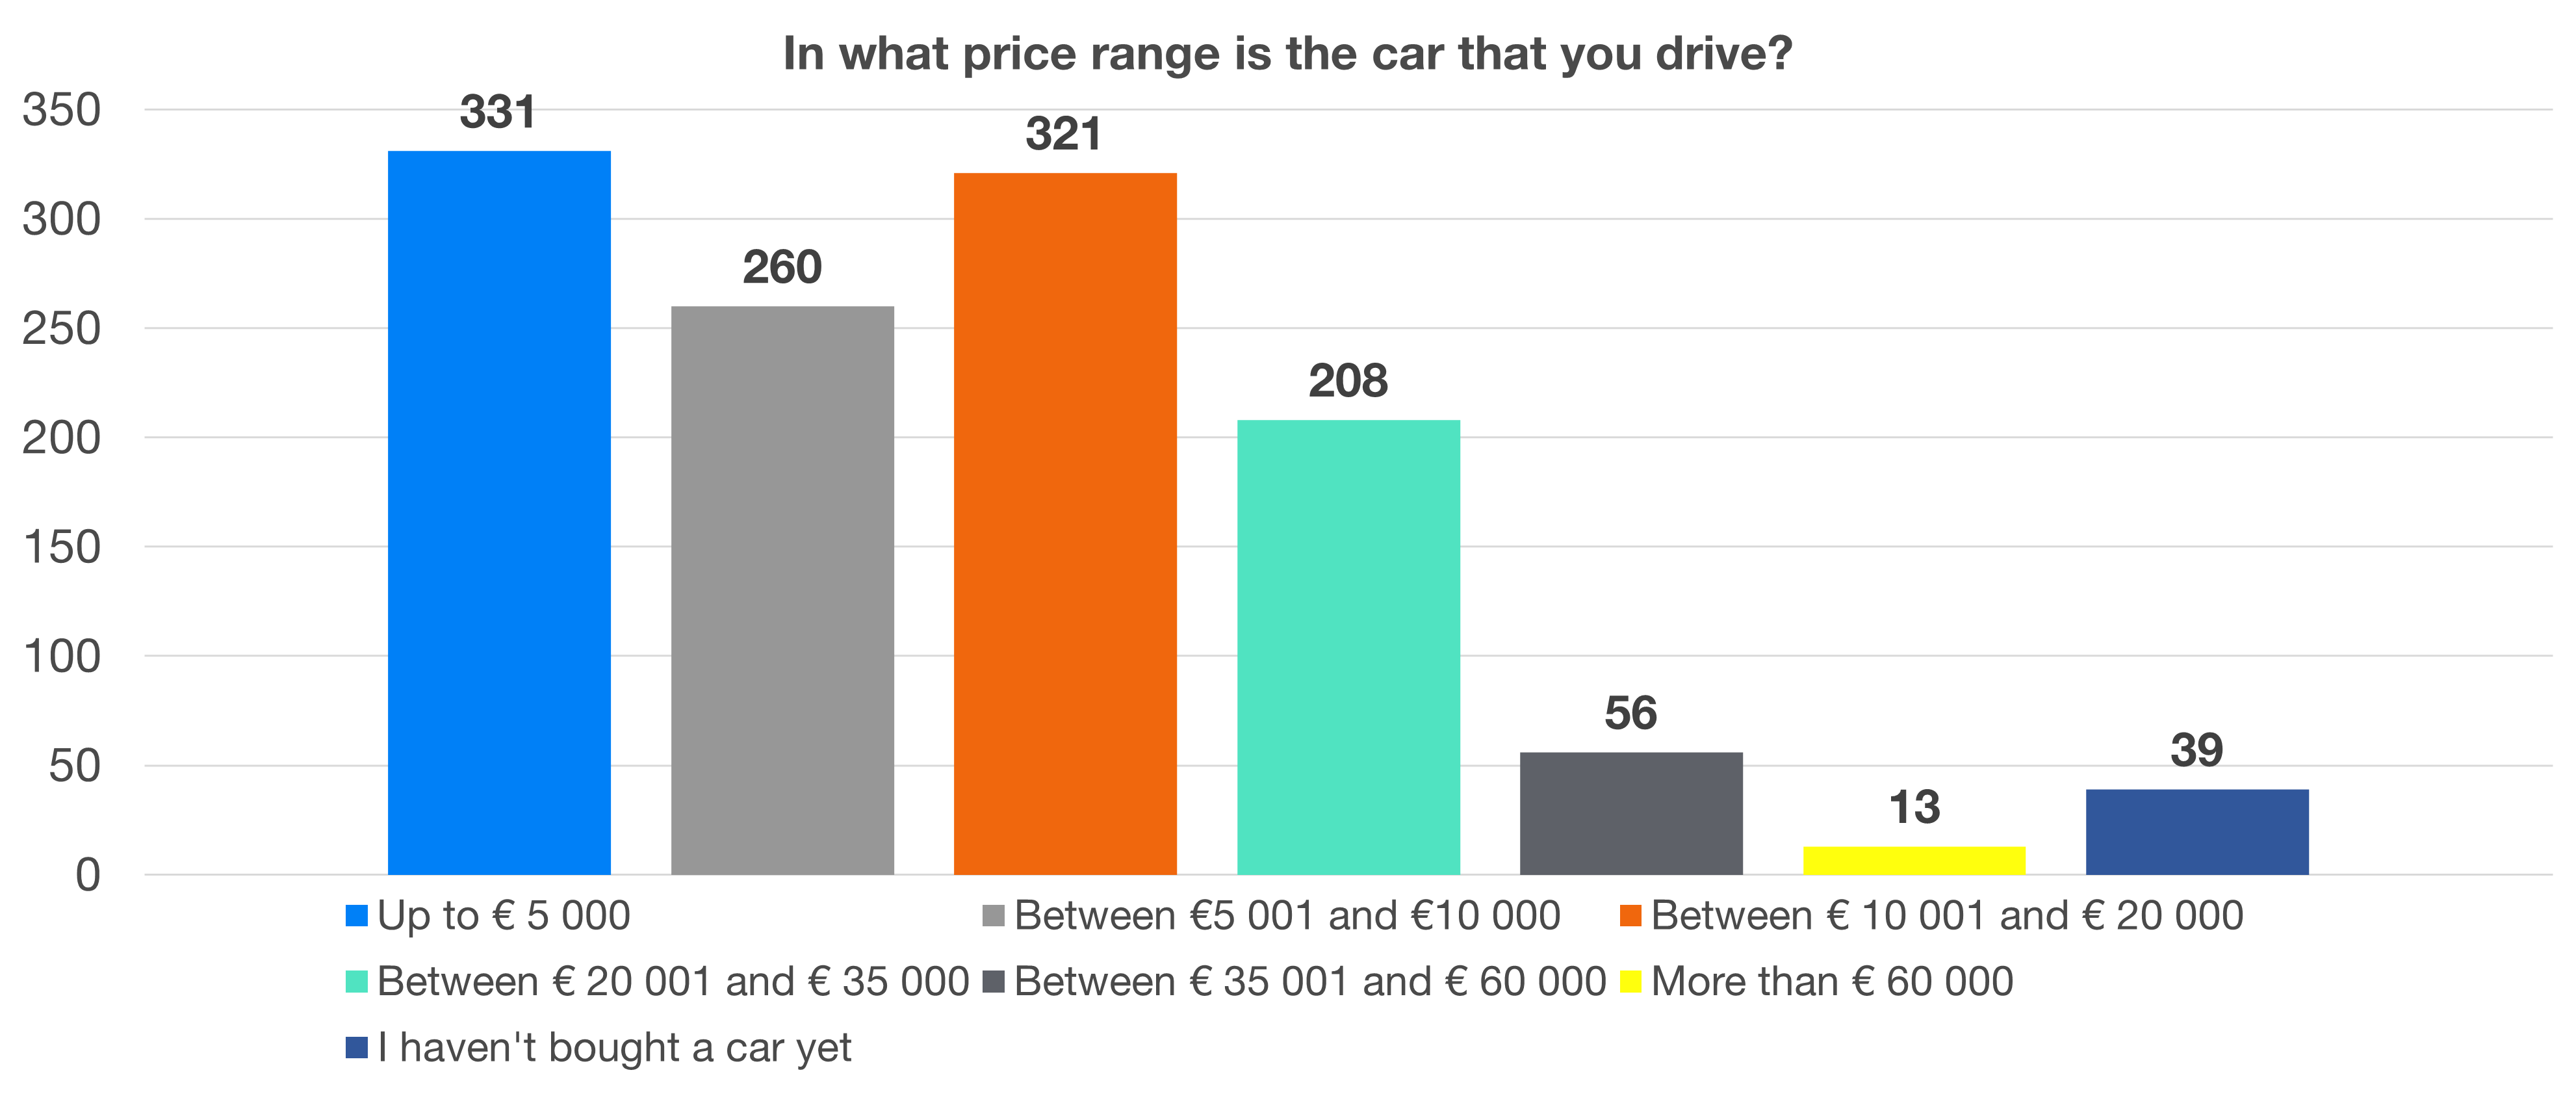
Nearly half of respondents drive a car with a price tag of up to € 10,000. From this data, I then calculated the average purchase price of our respondent's car by taking the average price of the car in the price range as the midpoint of the interval (for the 5,000-10,000 range, the midpoint of the interval is 7,500) and for the more than 60 000 range, I decided to go with € 75,000.
This resulted in the average price of a car of the respondents being € 14 254. I then combined these figures with the answers to the question whether you drive a new or used car. And some major differences can be seen.
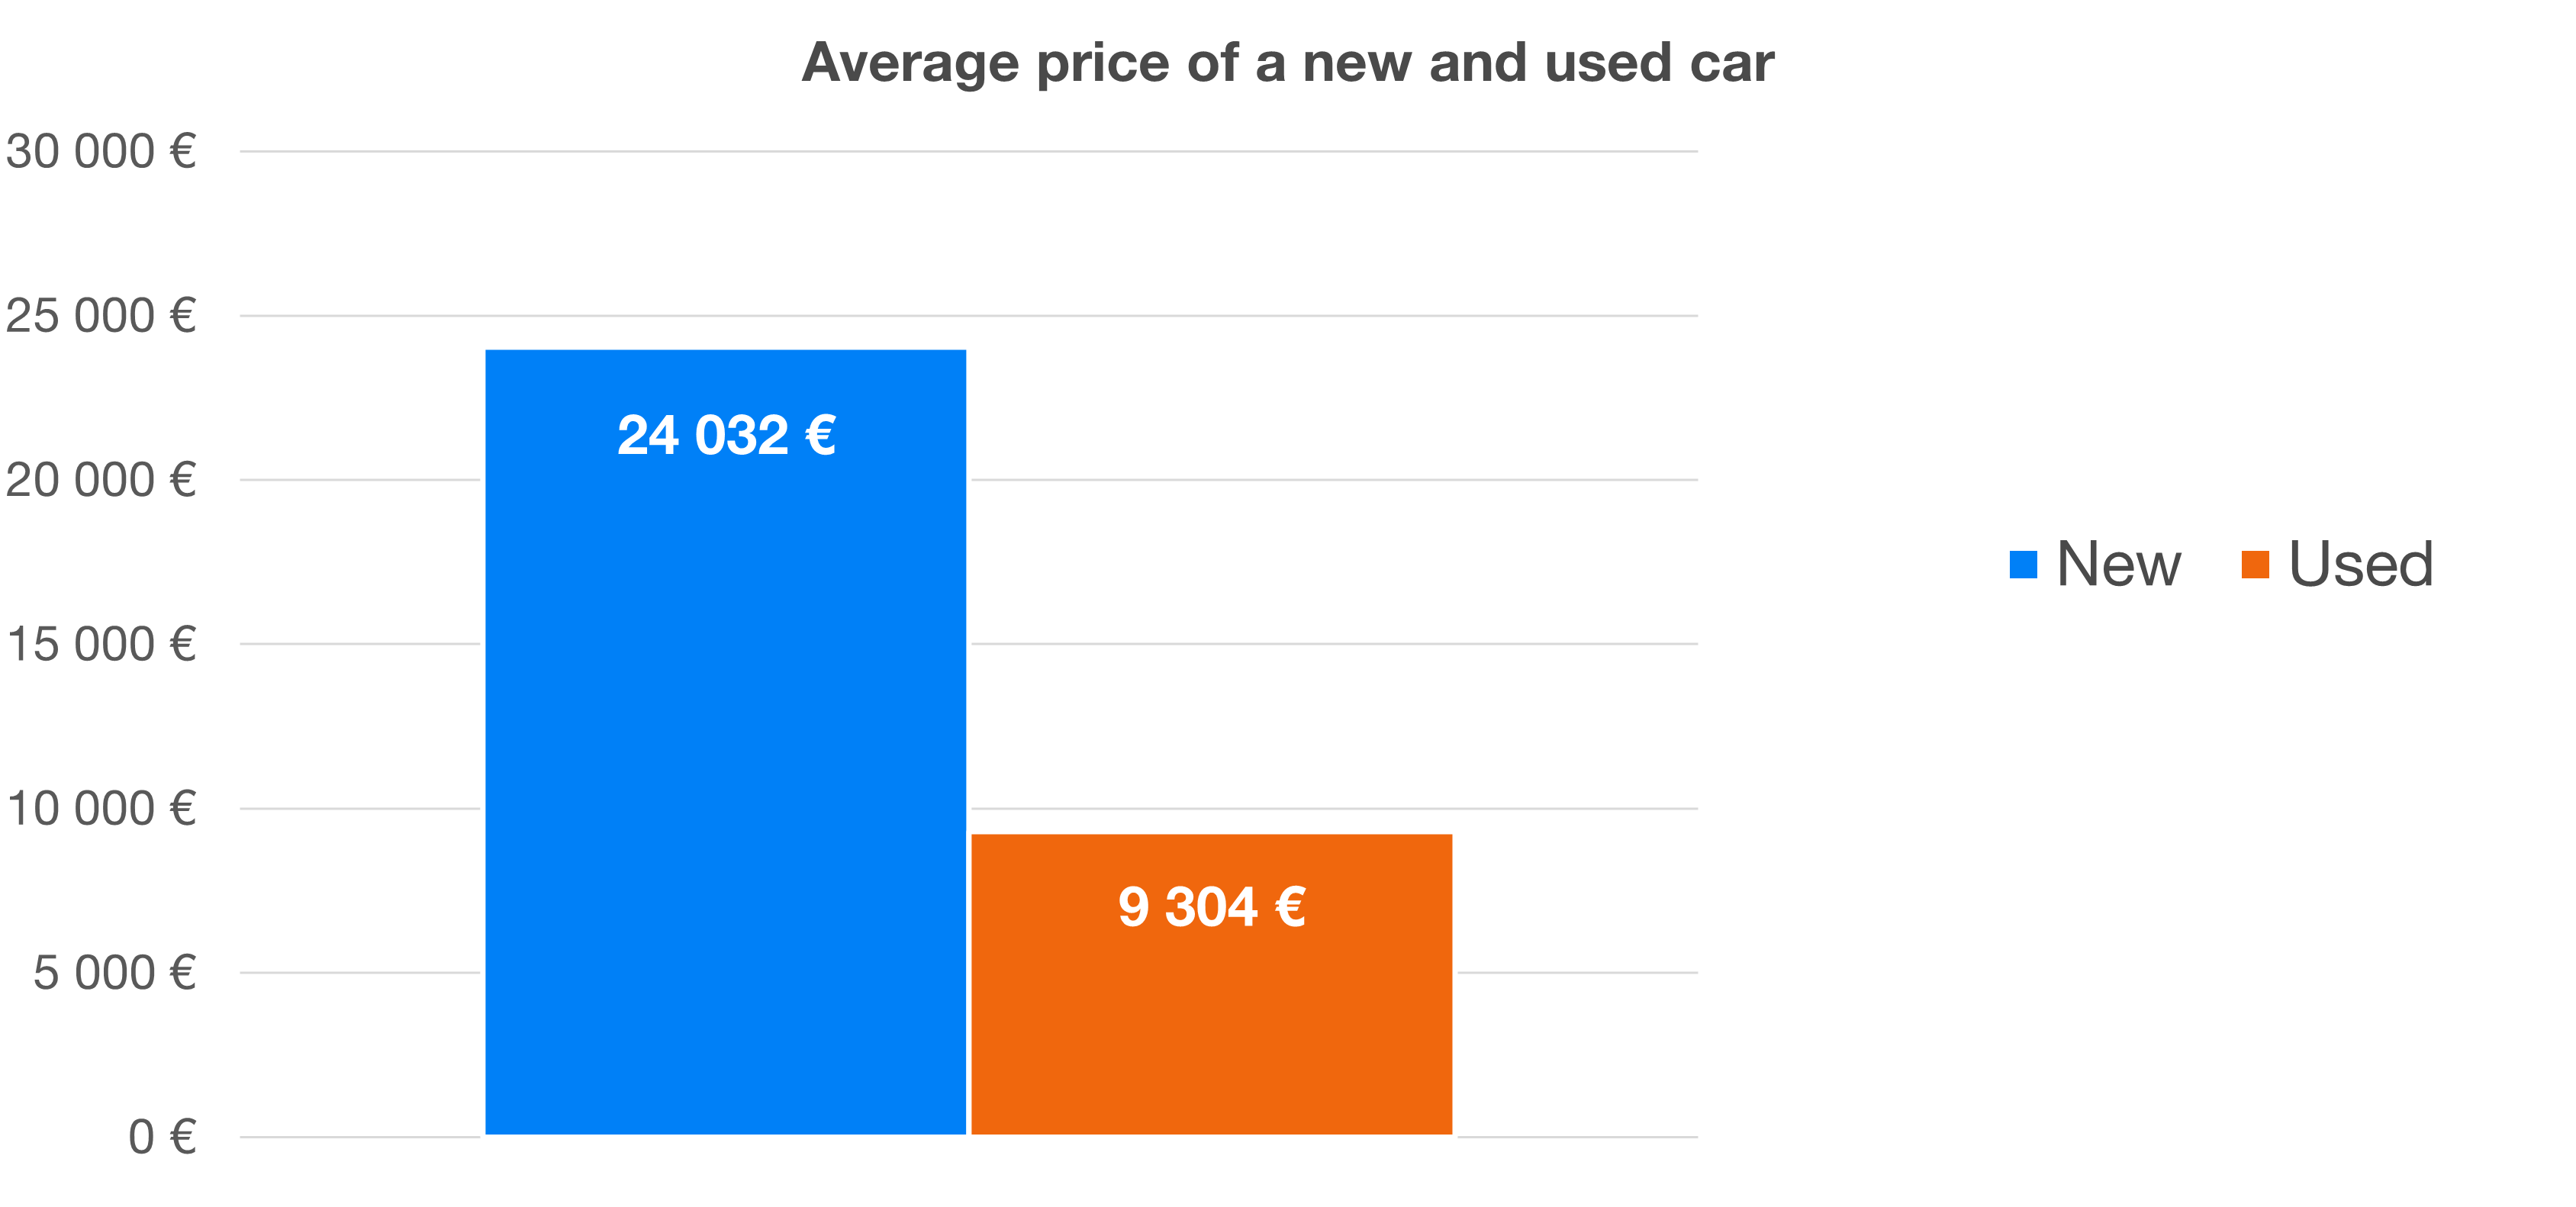
While the average price of a used car was €9,304, the average price of a new car was €24,032, which is 2,5 times the price of a used car, or almost €15,000 for the smell, status and comfort of a new car.
However, if you think that I am against new cars, I have to confess that my last two cars were new. But seeing those numbers, they may as well be the last new cars for a long time. I'll have to completely "ride out" my current cars to make them worth their money.
Even more interesting is the average price based on the owner relationship to car. Those for whom it is only important that the car gets them from A to B will pay an average of € 9,604 for a car. On the other hand, those for whom design, comfort and equipment are important paid on average € 18,895, or in the other words almost double. Your relationship with the car will thus significantly influence the price of the car.
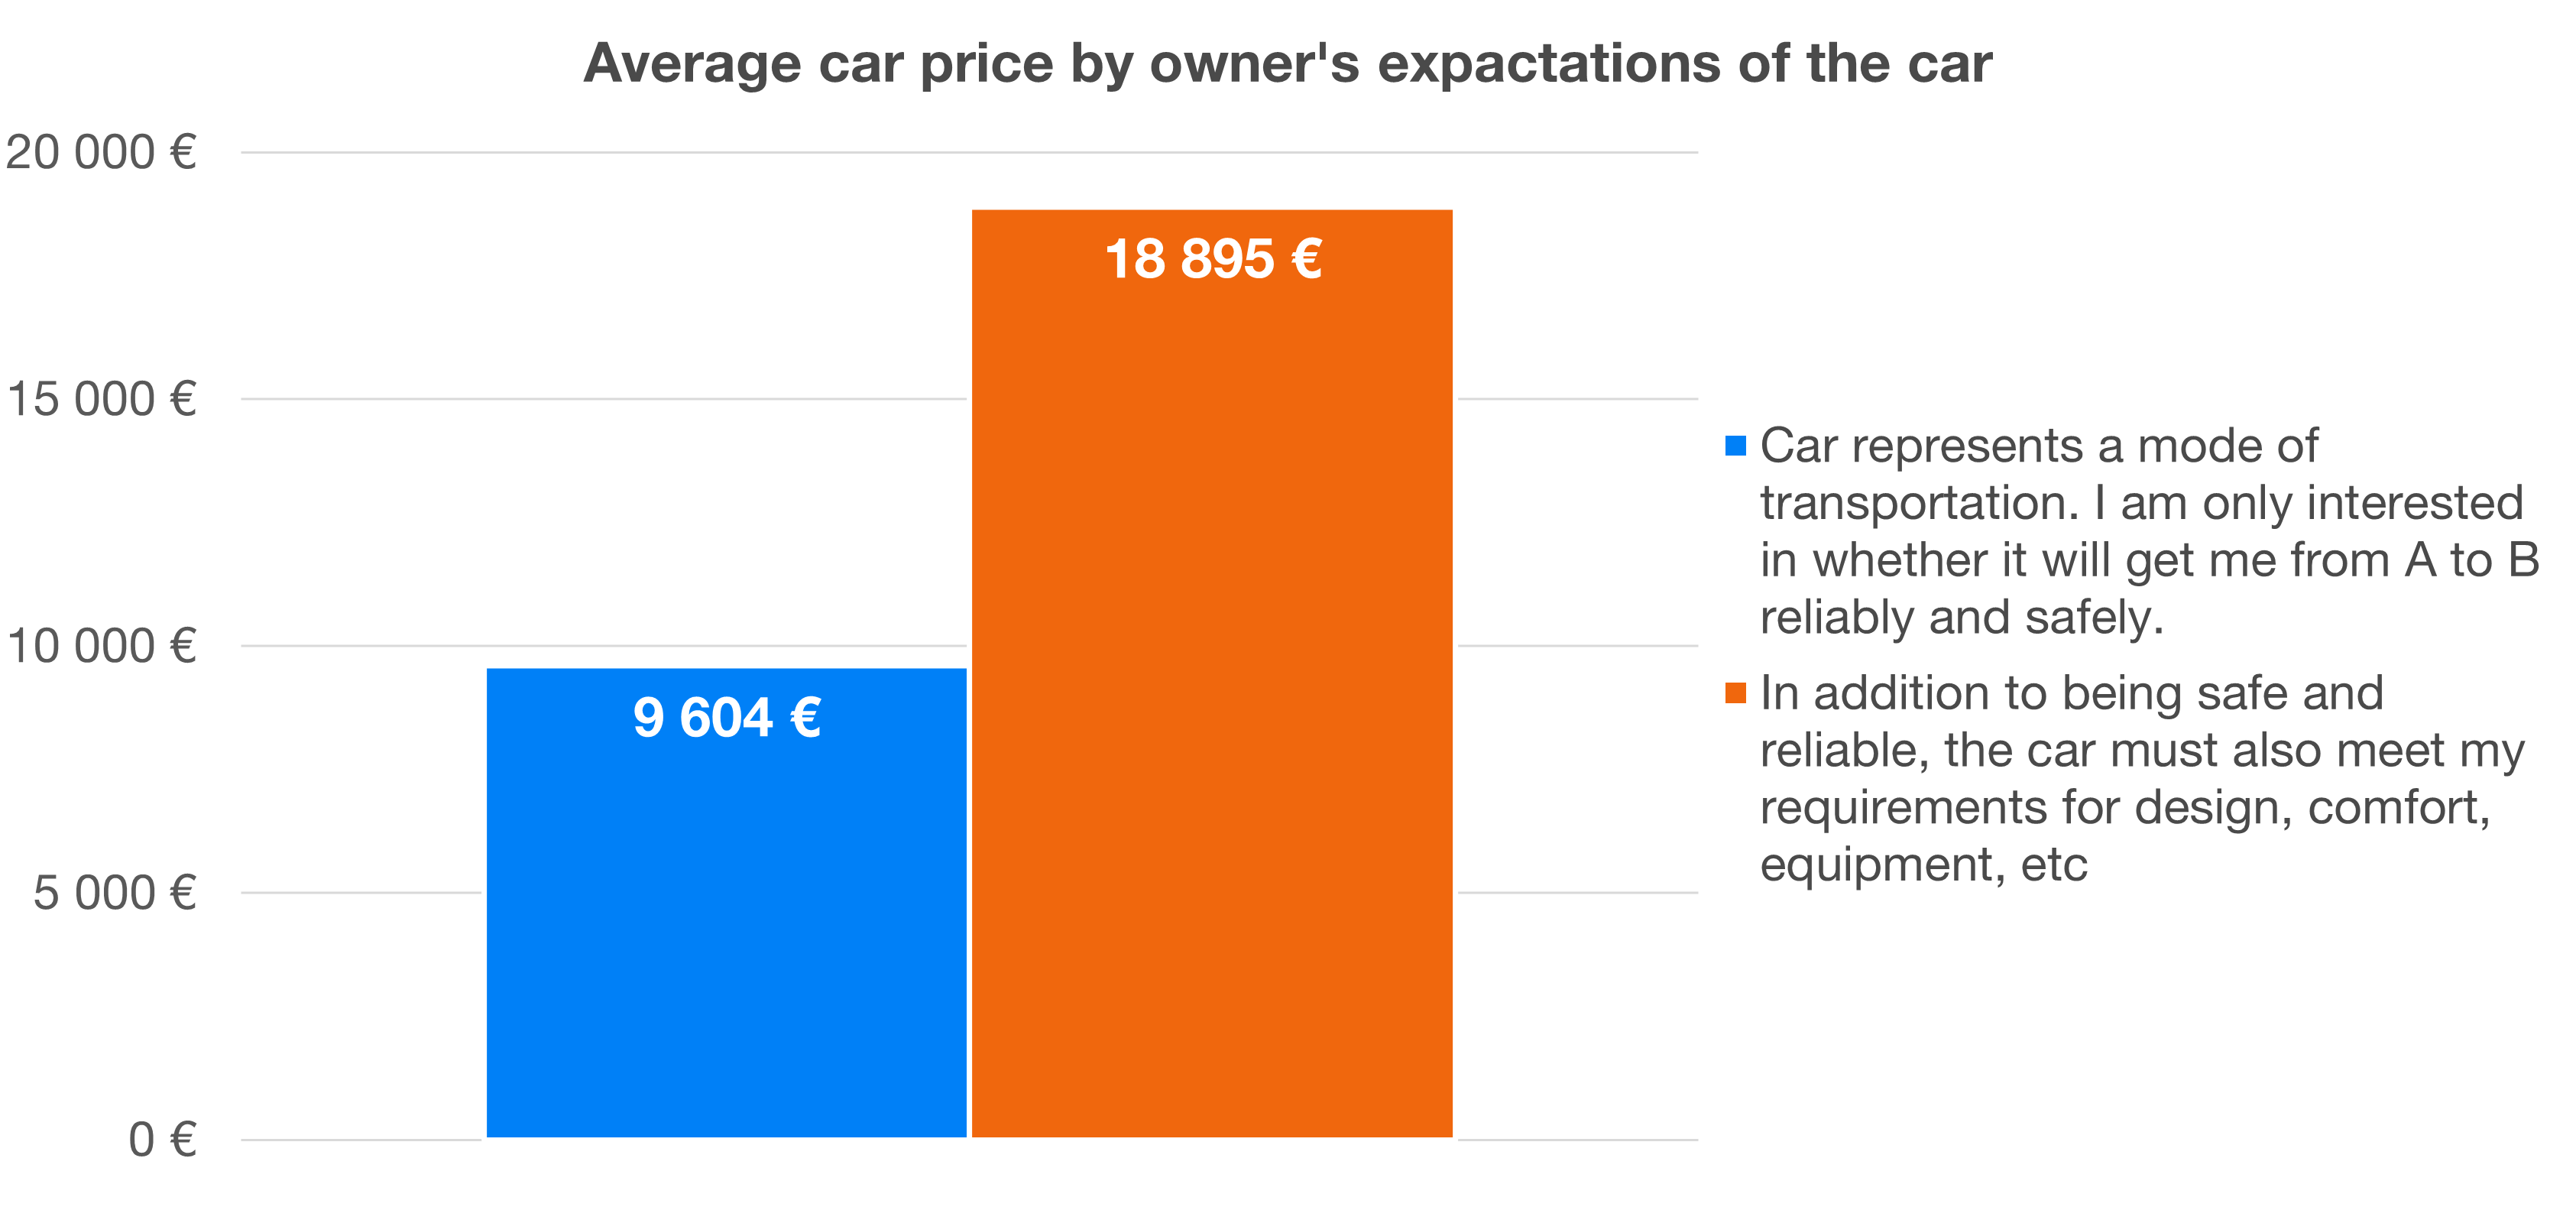
That means that your expectations of the car can end up saving you over 9k per car. If you replace it on average every 7 years, you would save 65,000 euros over your adult life. If you invested this sum with a 7% return rate, you would end up having over 400,000 euros for retirement. That is definitely something to think about when buying a car.
There was also a difference in the prices of the cars by country. While in Poland 64% of cars were up to 10,000 euros, in Slovakia it was only 43%. As I said before, I wouldn't like to draw any conclusion from this, as we have different client demographics in Poland. Polish clients are mostly younger age groups and people with a higher interest in personal finance.
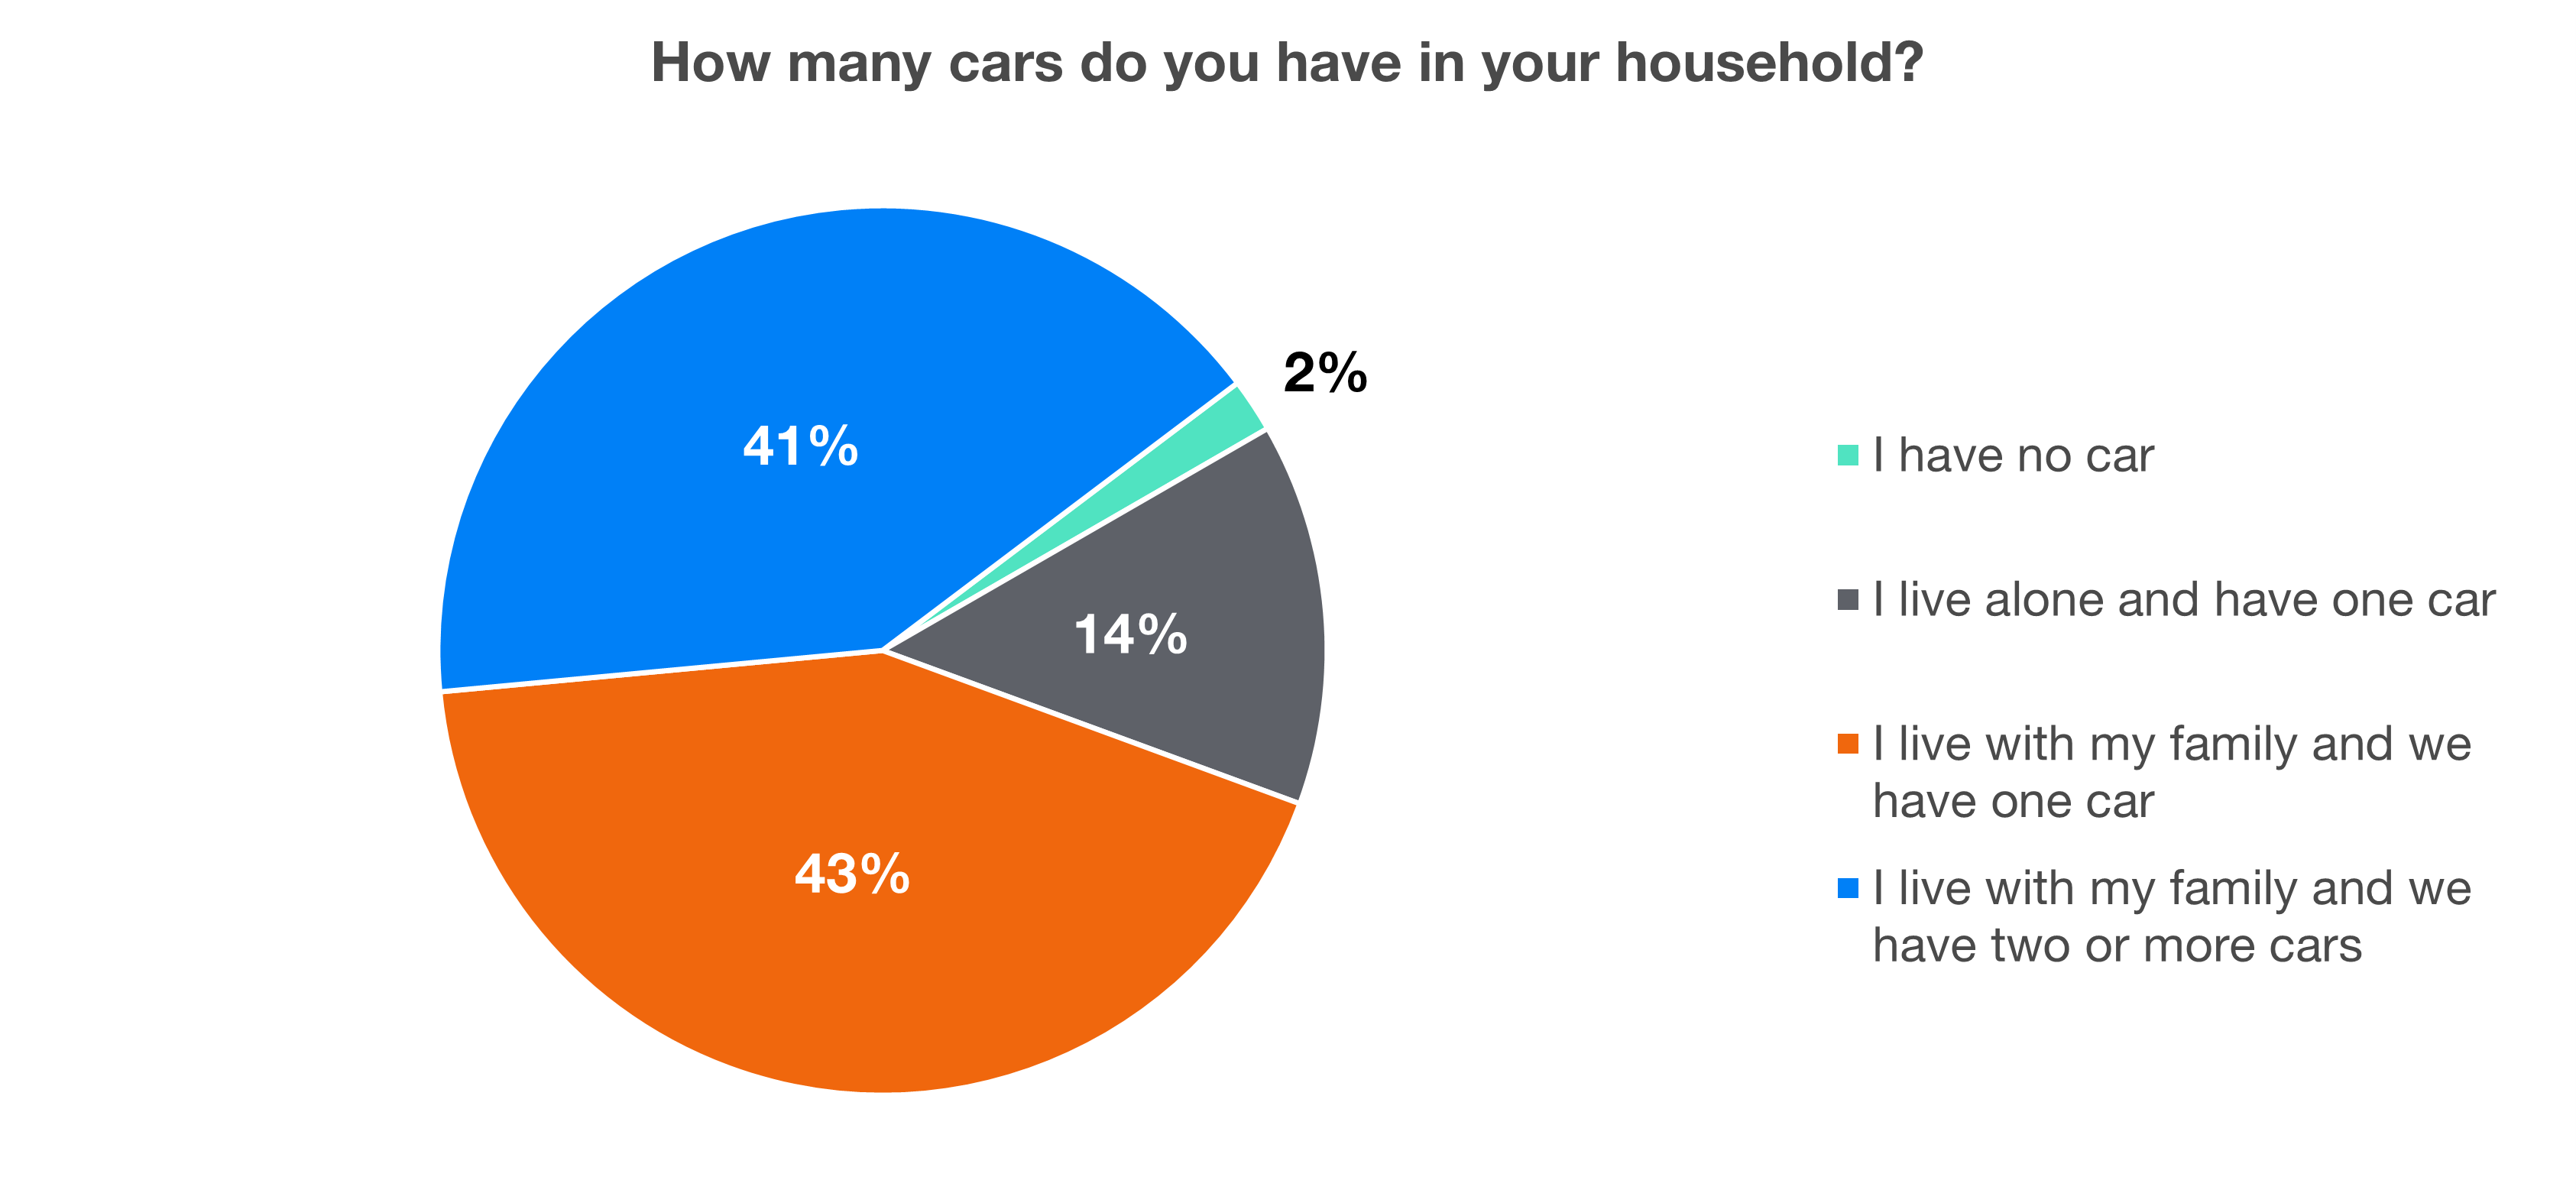
Up to half of households have two cars in the family (41% vs. 43%). This also shows the higher living-standard of our respondents. Adding in those who have their own car and live alone, 55% have a car only for their usage. Here I see an opportunity for a business plan of the next decade. Shared cars. As I had the opportunity to experience them in Berlin, I believe they will become even more popular in the future.
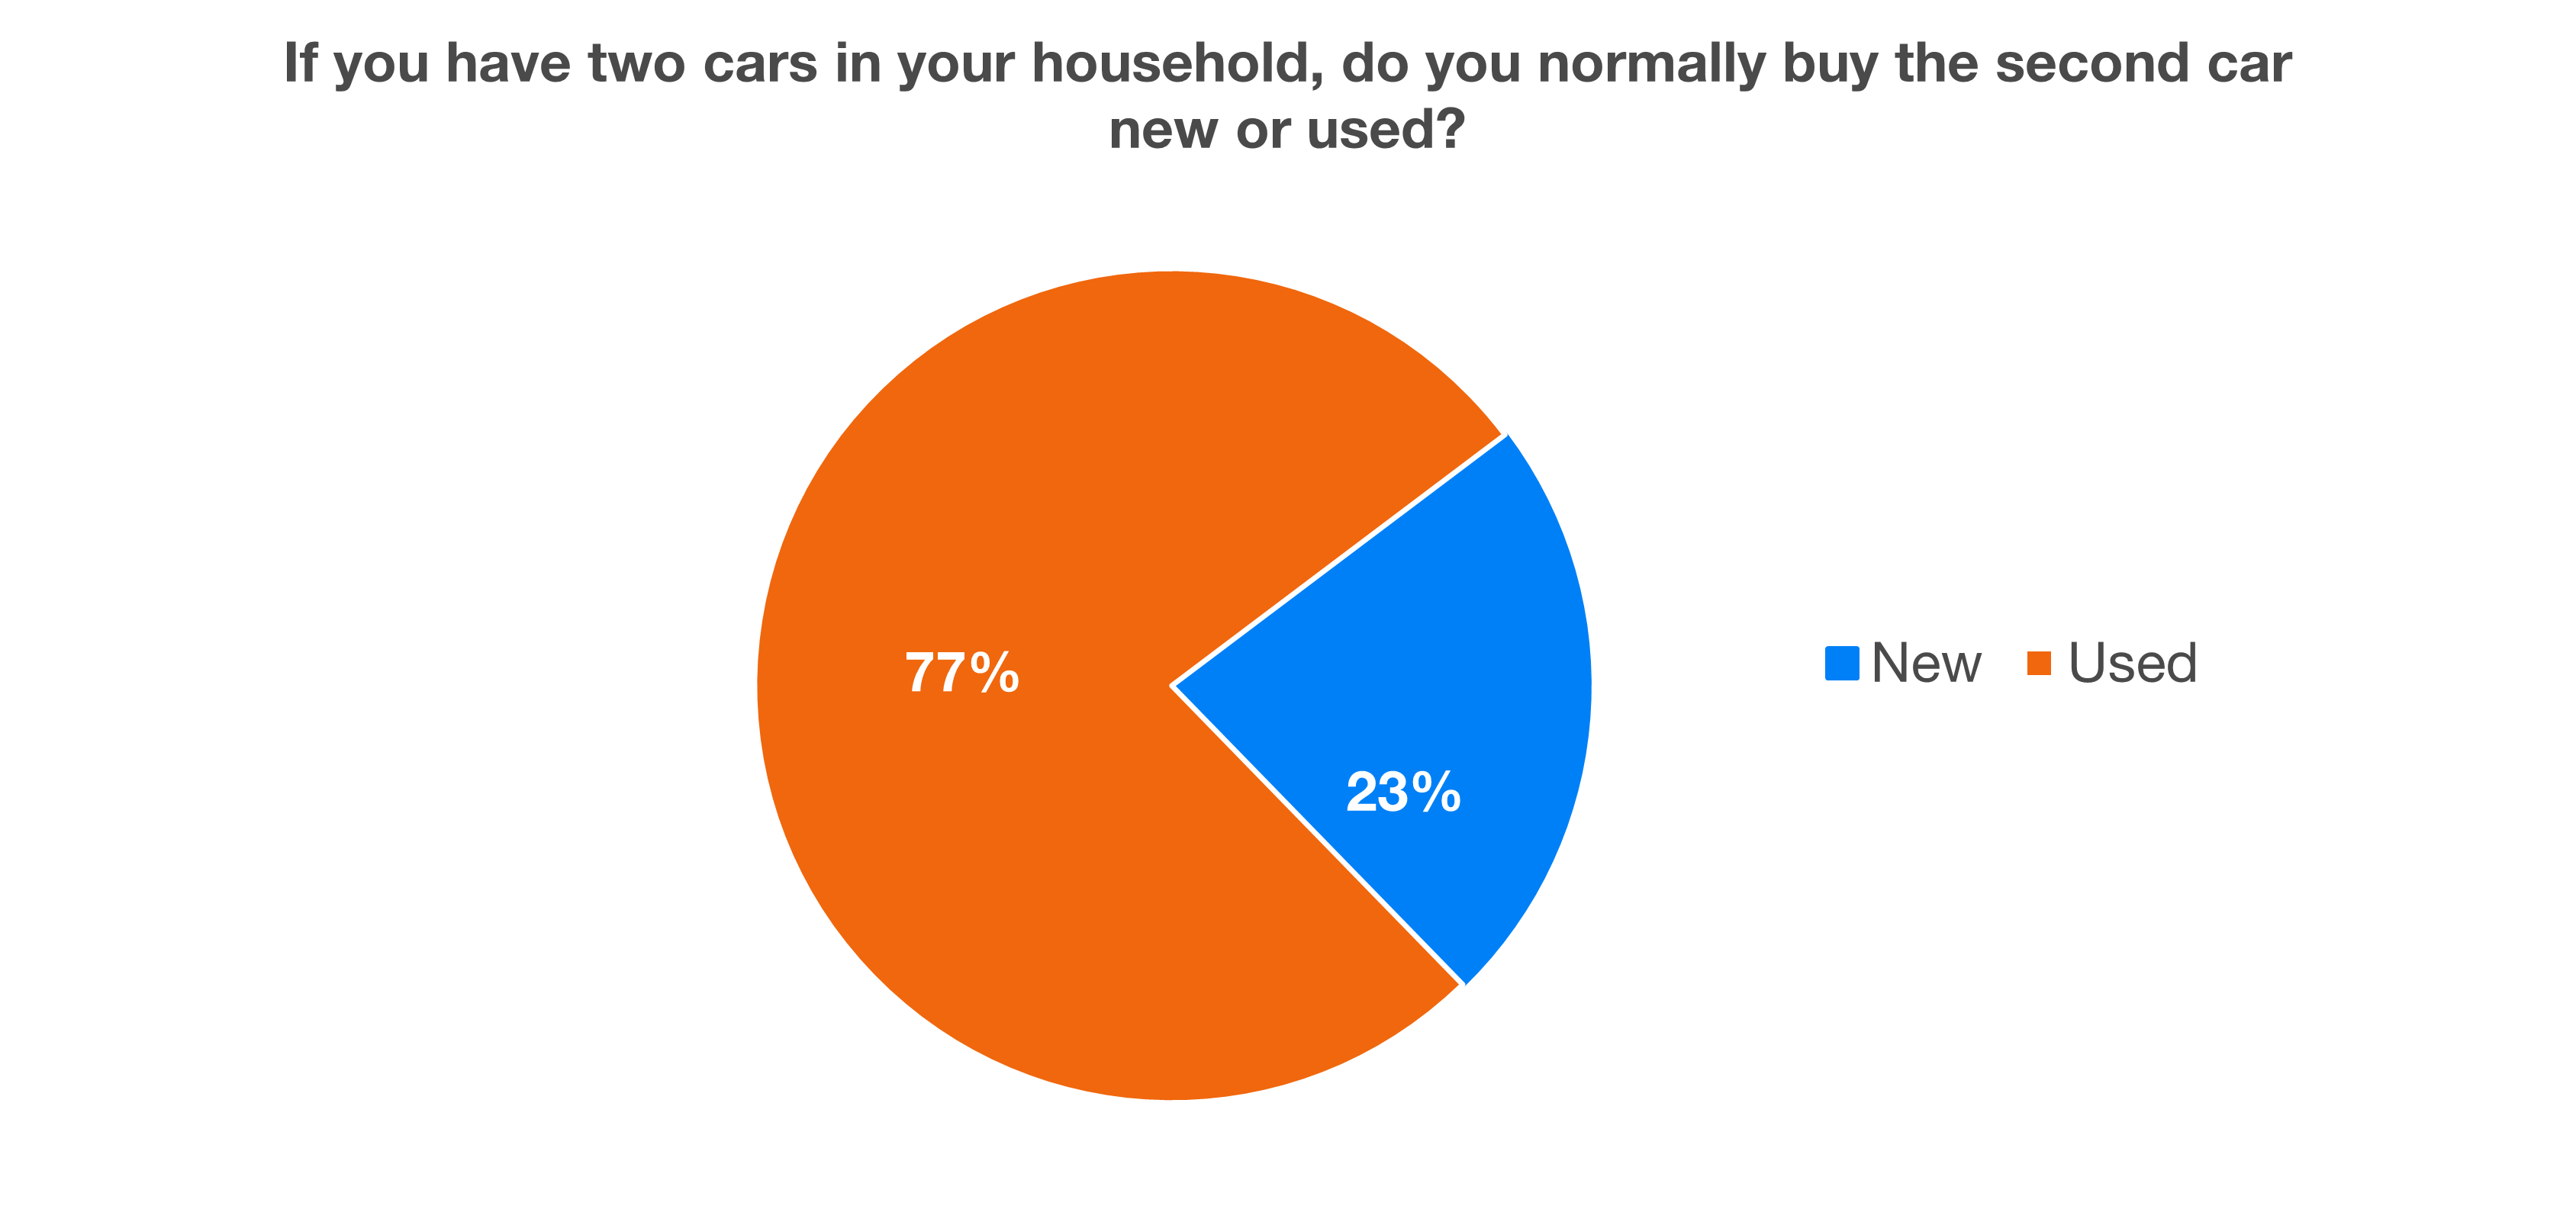
As can be seen from the chart above, up to 77% of people who have two cars in their household, decided to go with the used car as their second one. This is higher compared to the last car bought question, where only 66% were used cars. People are more likely to go with the used car, when buying a second car in their family, which is very good sign from a family budget perspective.
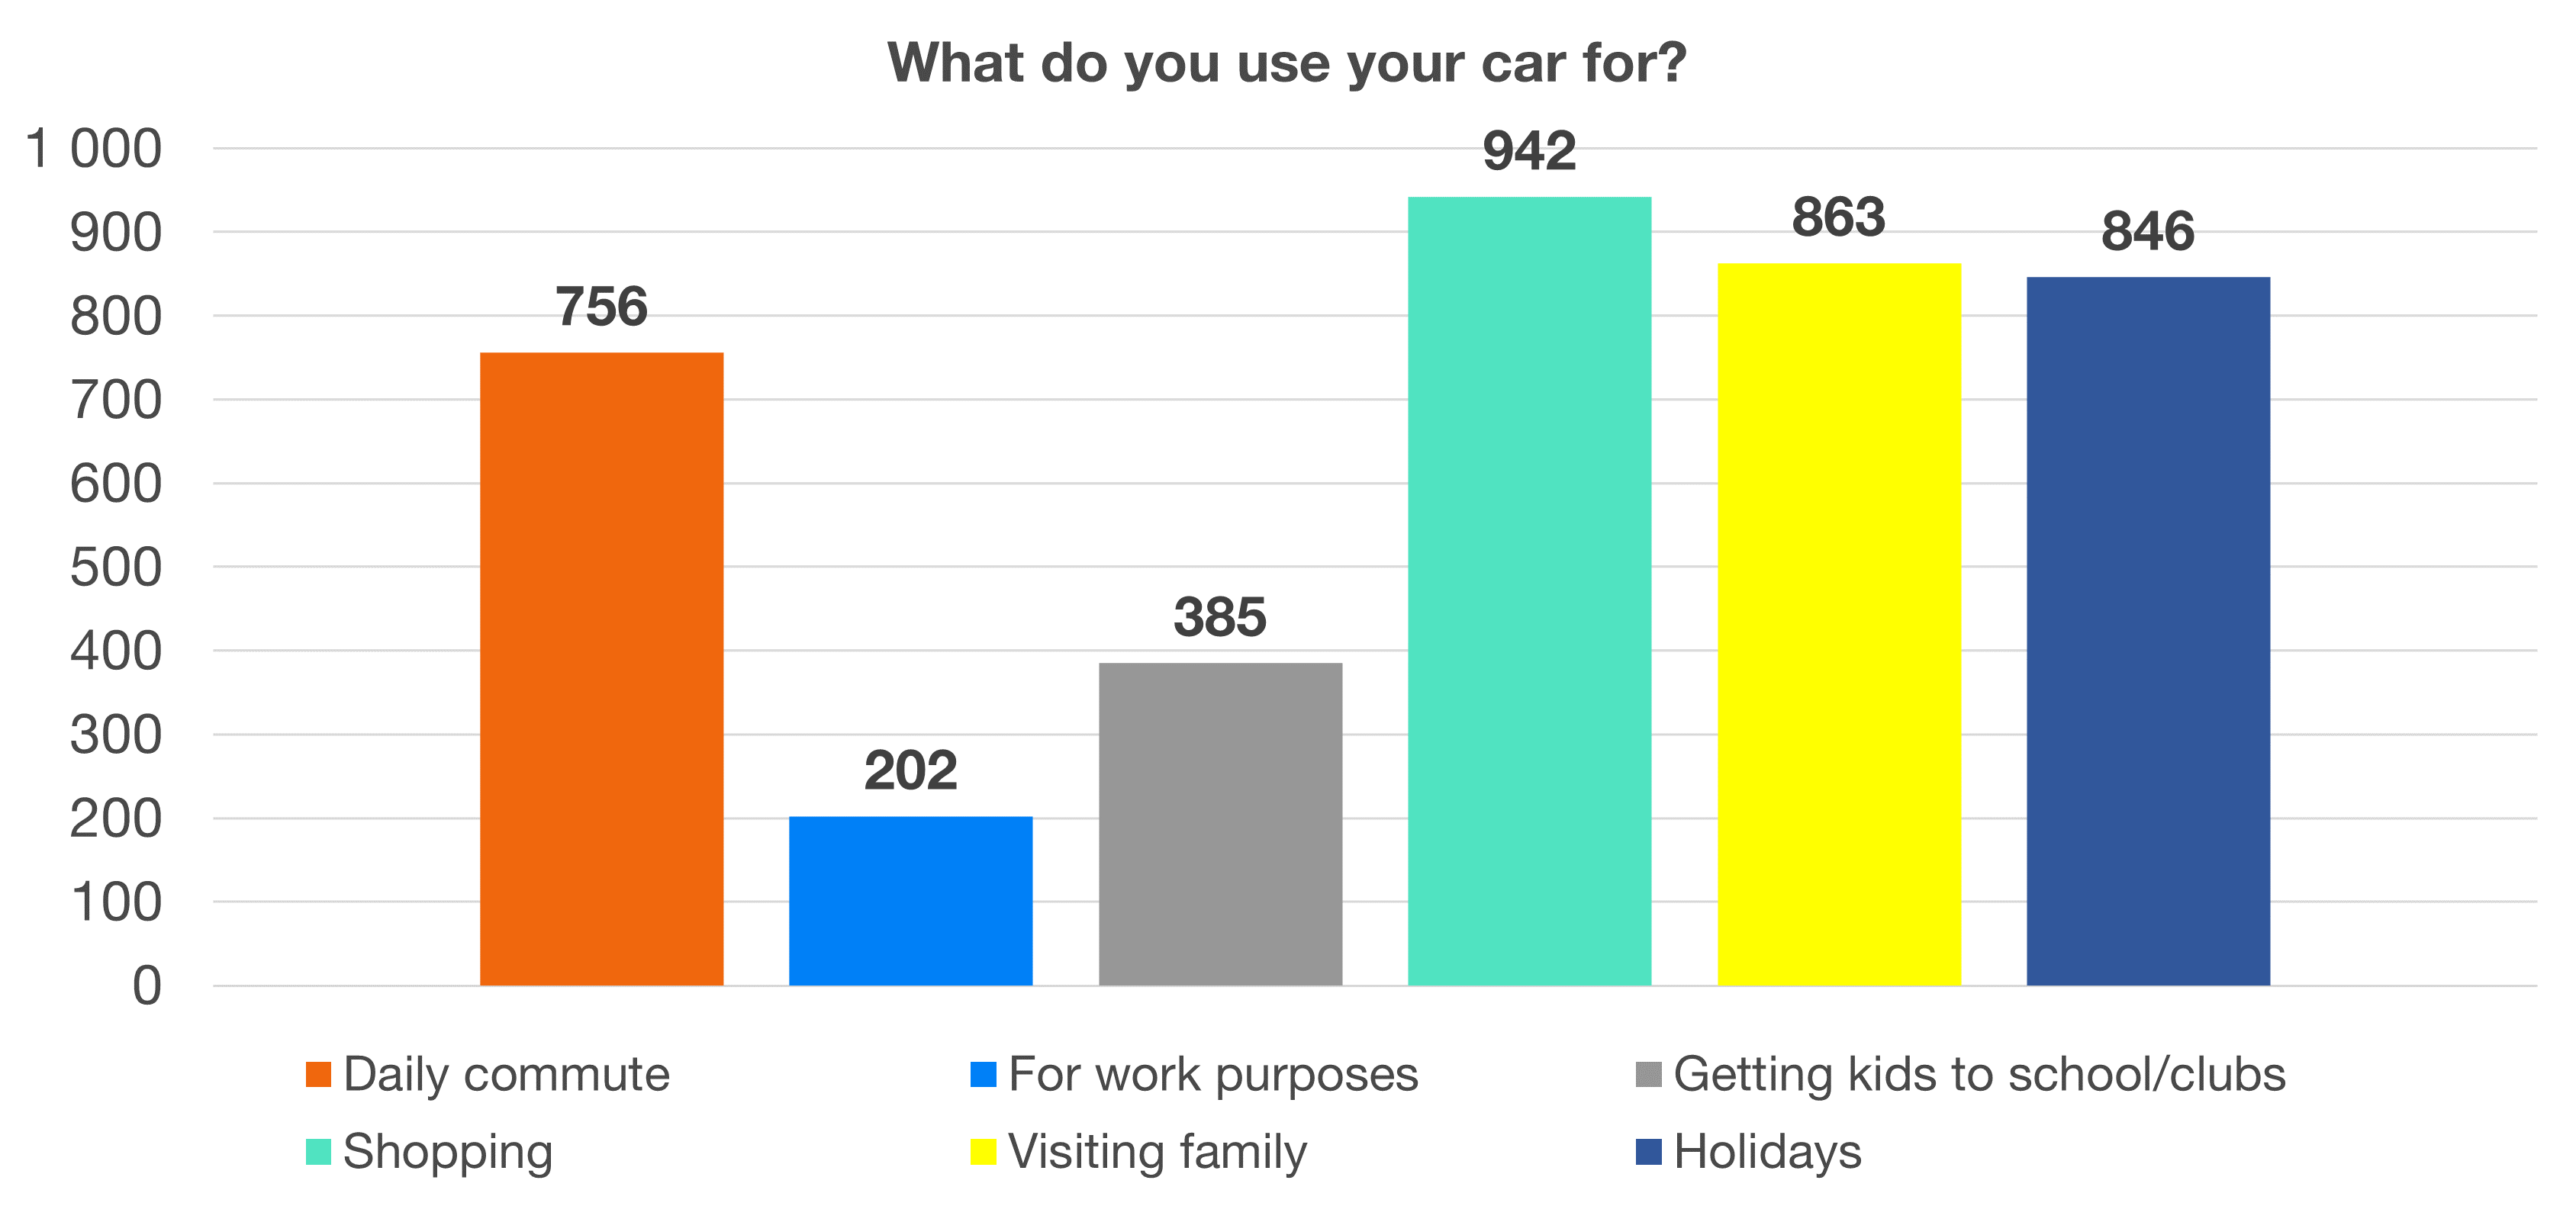
Another interesting statistic is car use, with up to 62% of people using their car to get to work. I take it that some of this is due to the higher living-standard of our respondents. It will be interesting to compare this statistic with the national average from the 2021 census.
However, I daresay that this number is result of the failure of state to create quality infrastructure to persuade drivers to switch from cars to other means of transport.
The following questions were created with future blogs on cars in mind. My future blogs will be focused on finding the sweet spot for buying and selling a car. Therefore, I was wondering when do you plan on selling your car.
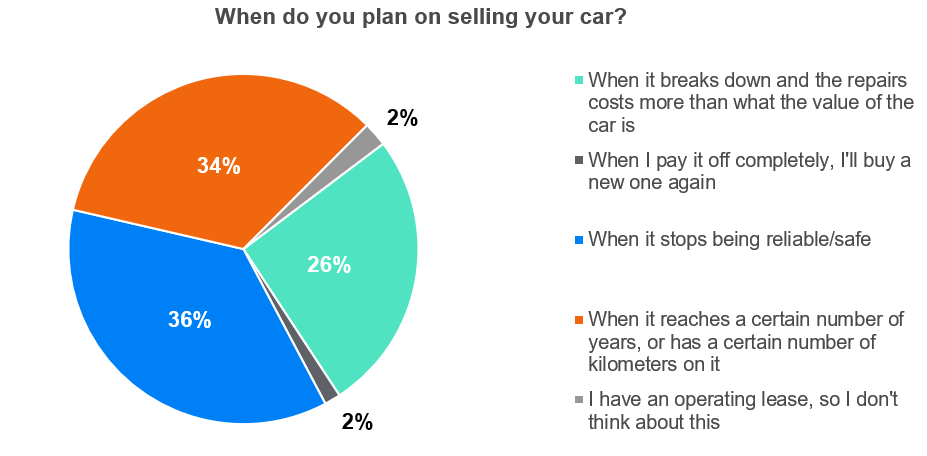
As can be seen from the chart, three main groups of respondents by preference of use have arisen. Each of these groups has slightly different expectations of car and its functionality, so we will probably look for the sweet spot for each of these three groups separately. I'll have to think about that a bit more. However, there was another question with this subject in mind.
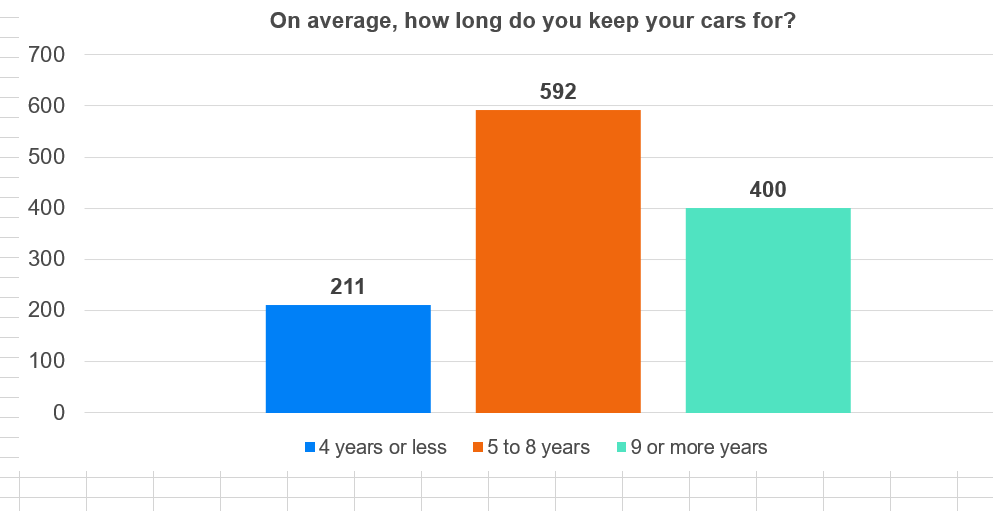
Based on the answers, it can be seen that the average will be somewhere around 7 years. I have some more interesting charts on this topic, but I'll look at them in the next blog.
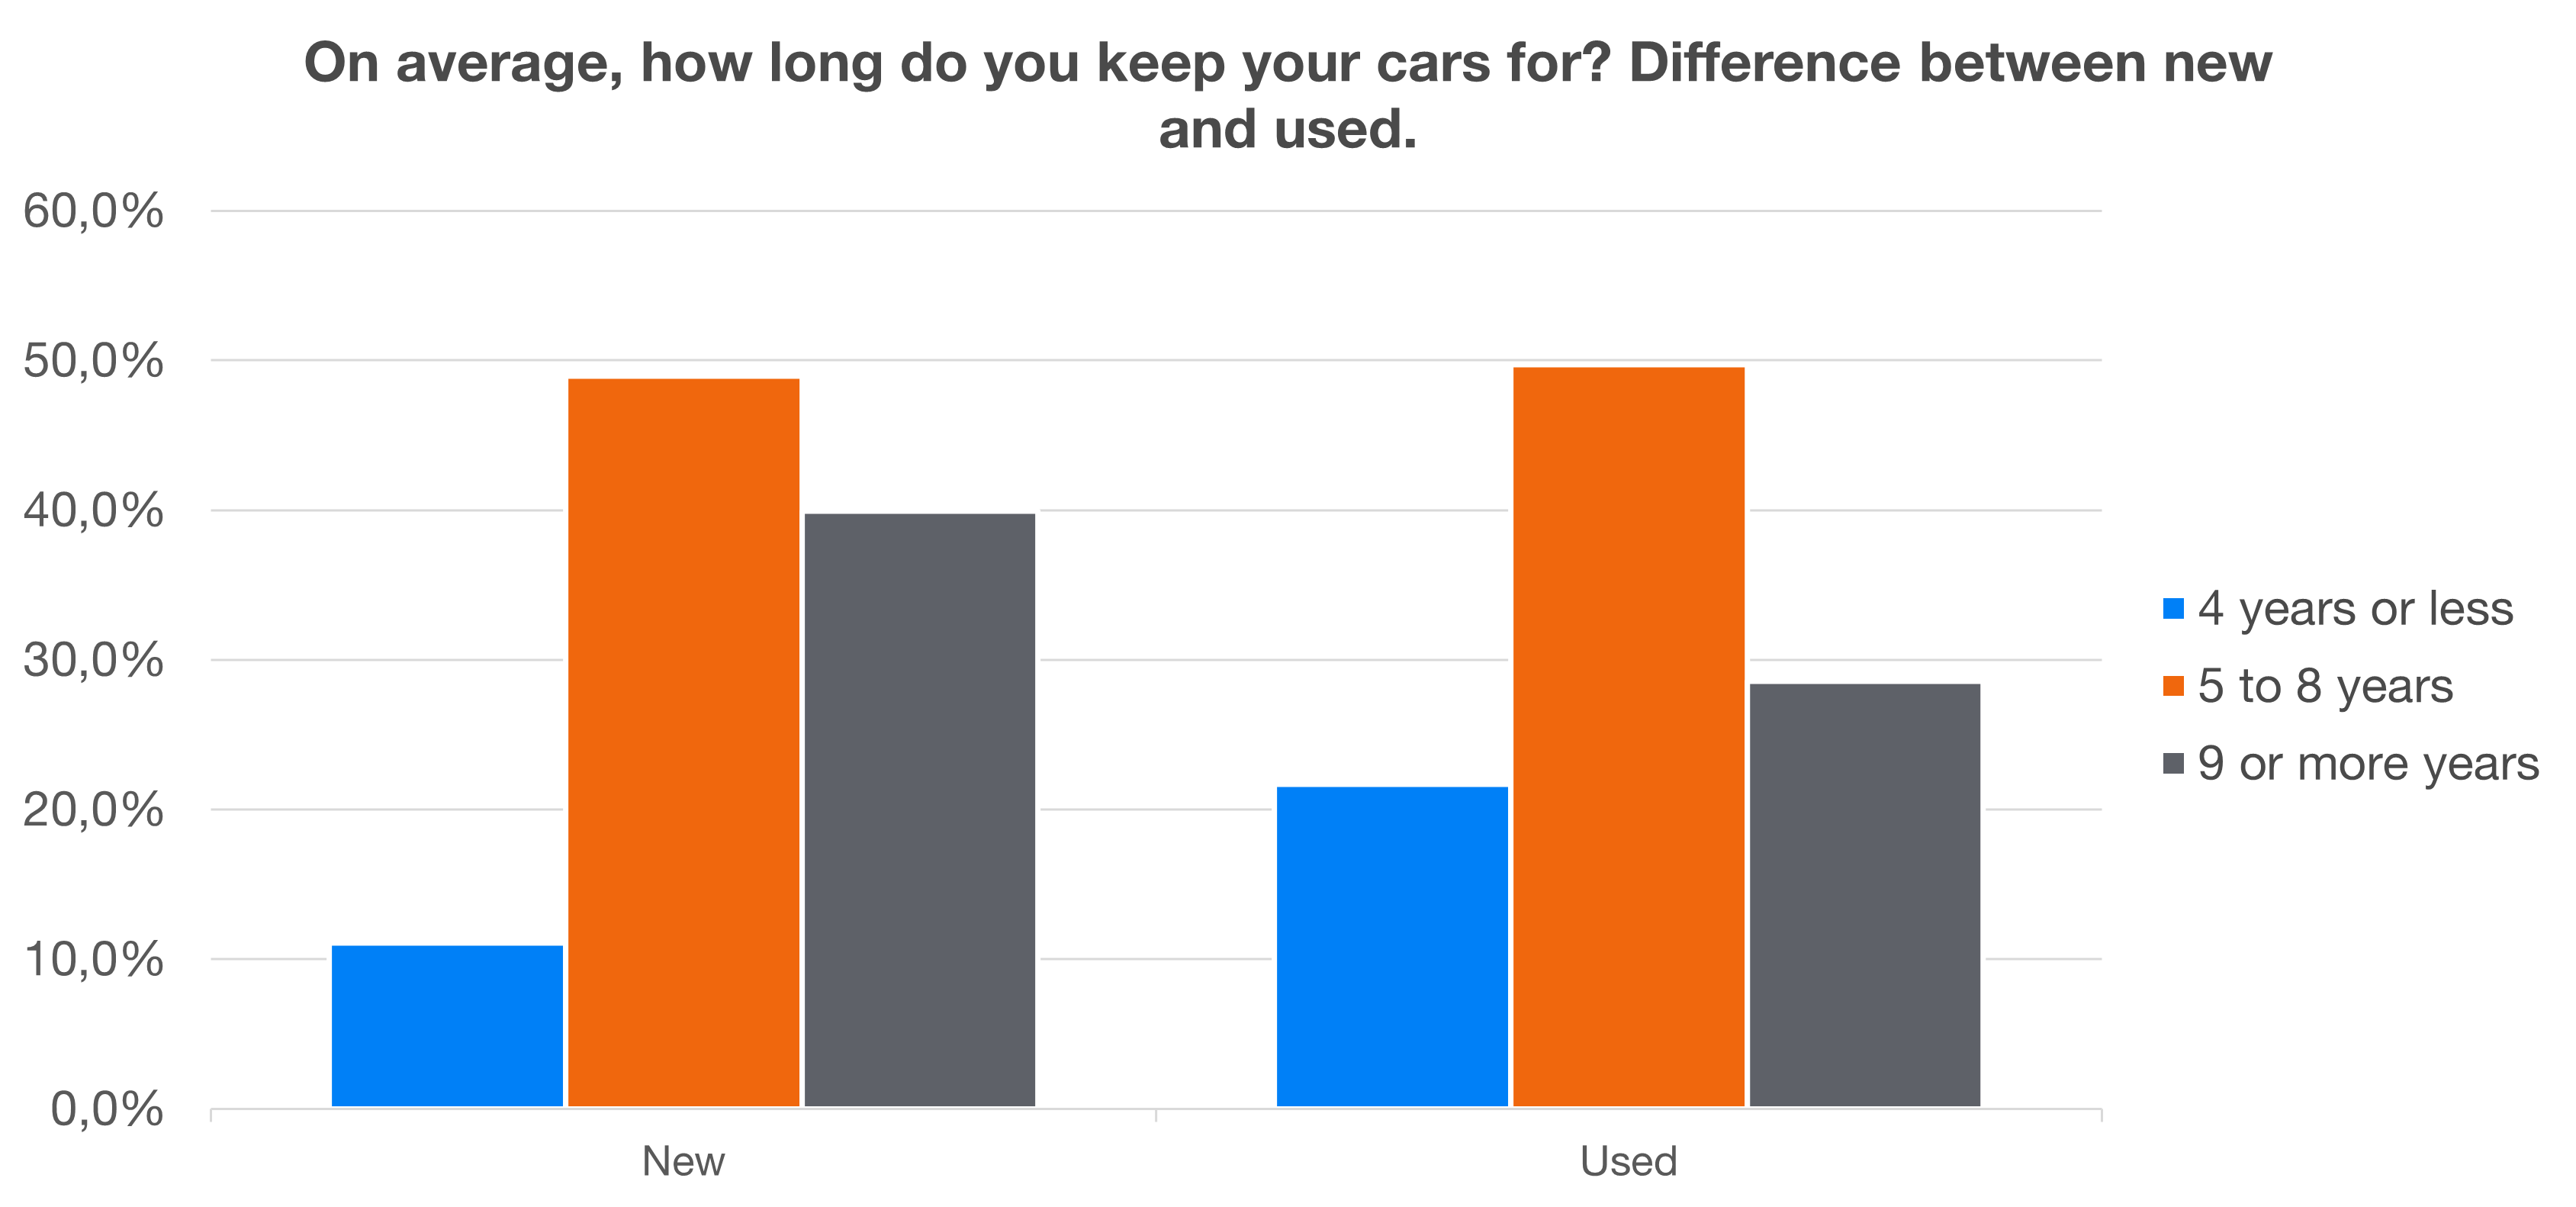
There is also a significant difference in the answers of polish and Slovak respondents, but this is mainly due to the fact that Polish respondents bought more used cars and thus keep them for shorter periods of time.
I was very pleased with the answers to the last two questions. See for yourself.
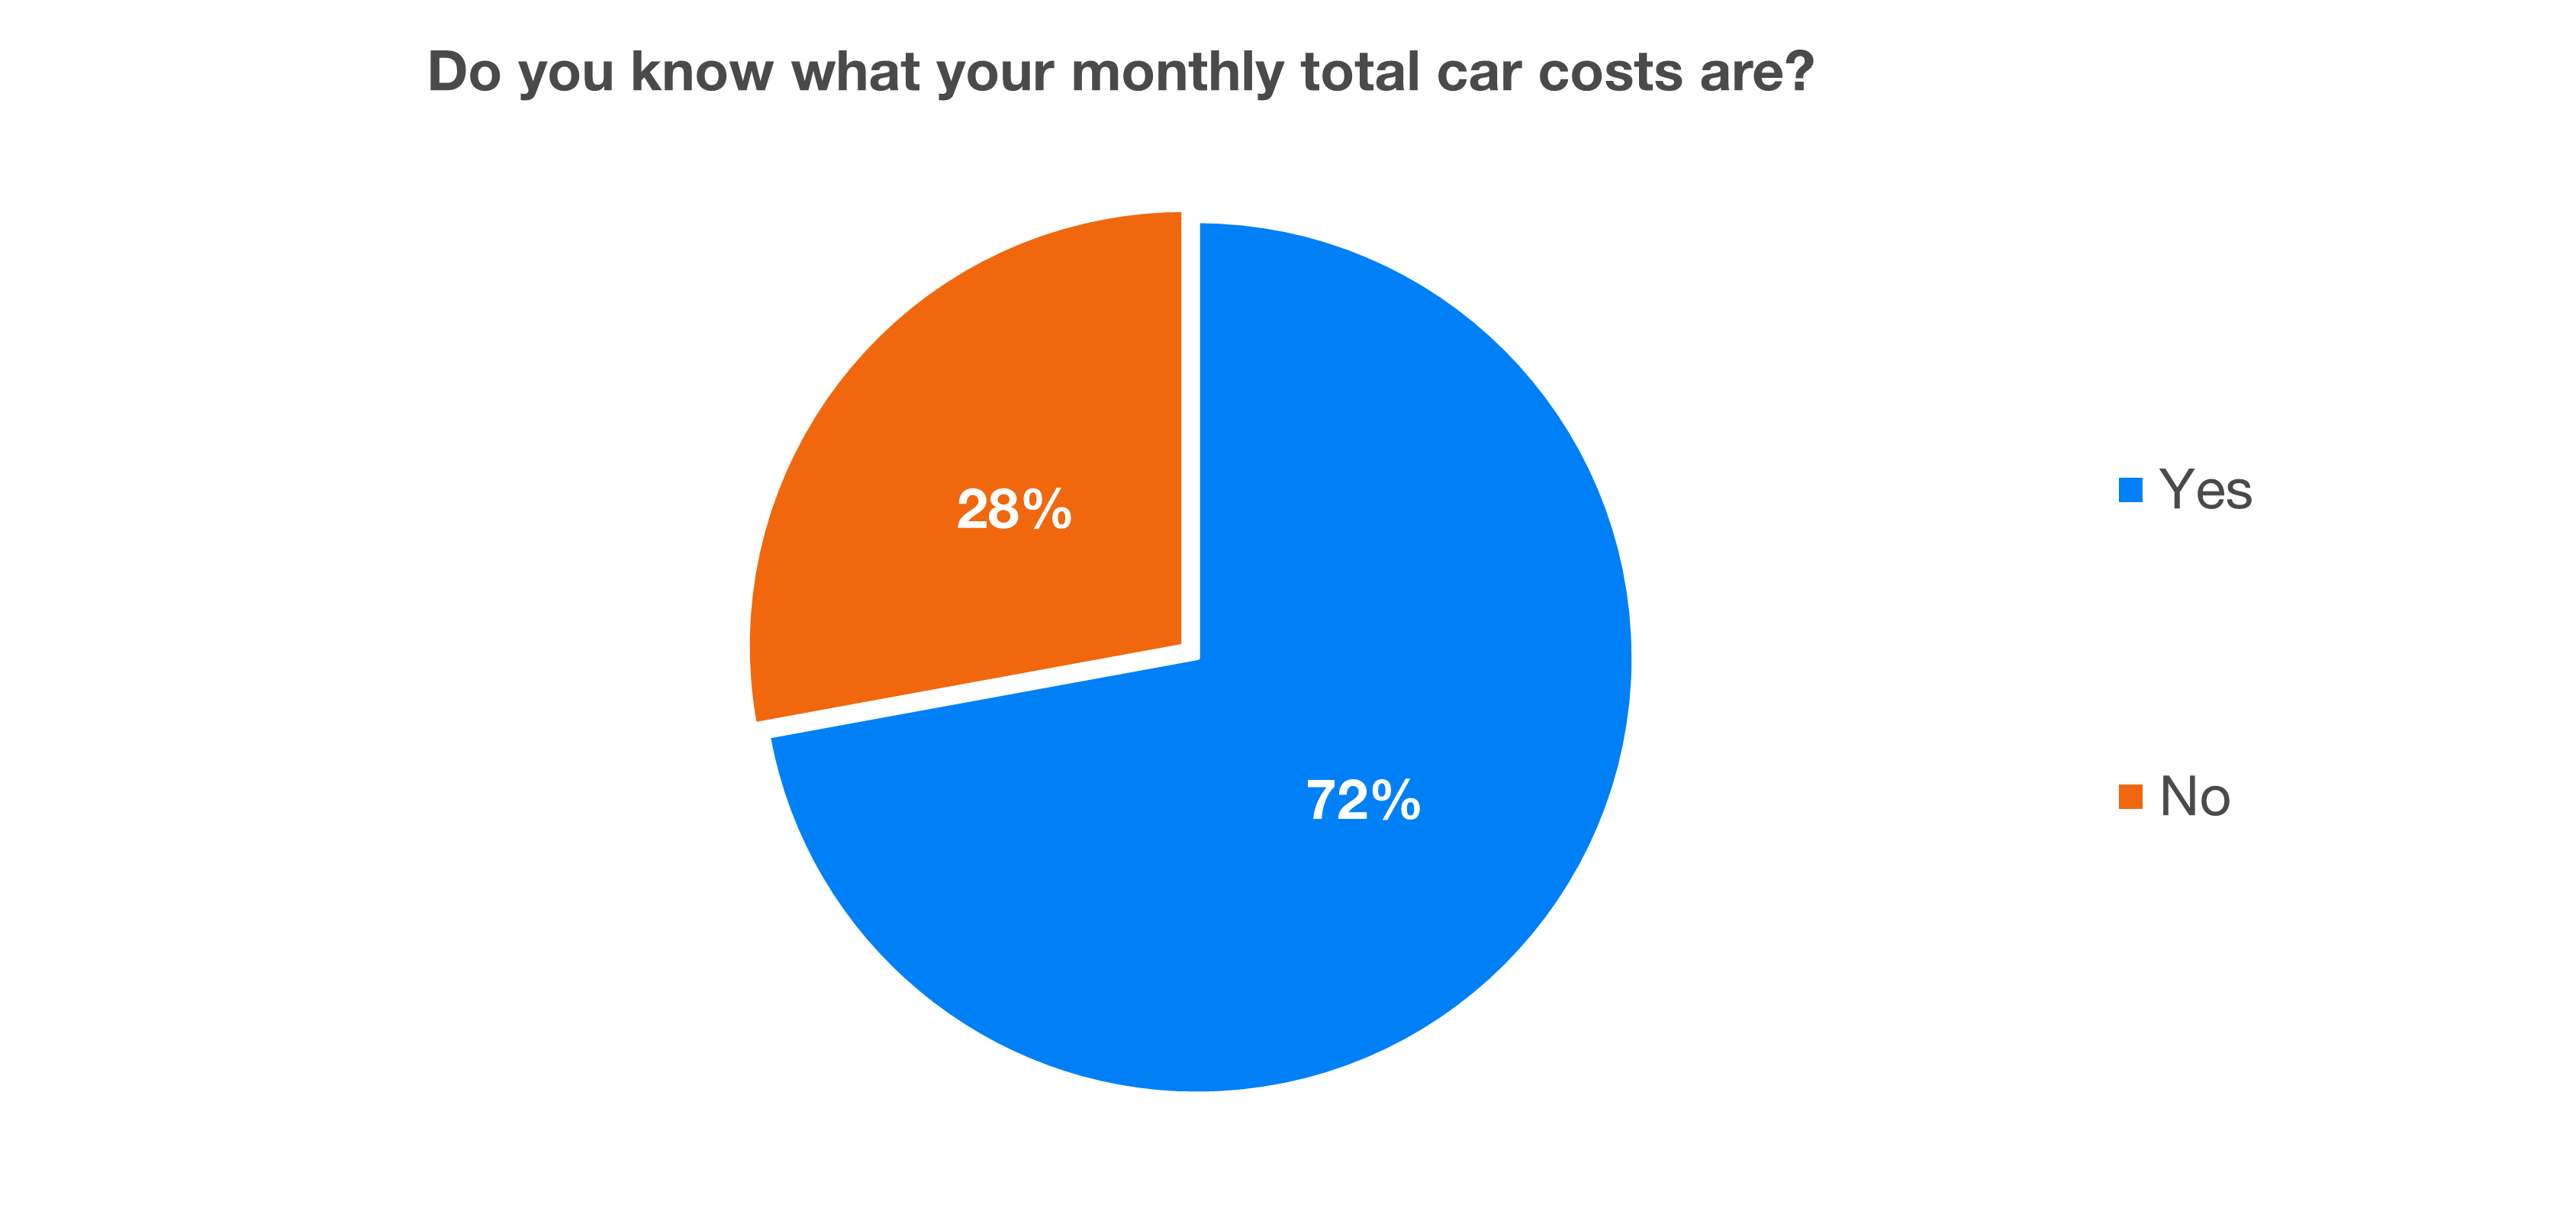
I would very much like this to be true, but I would be cautious when interpreting this chart. I understand that people keep track of basic costs like service and gas expenses, but they probably don't calculate them in greater detail, such as taking into account car depreciation. This was explained in one of my last blogs on the actual cost of a car. Or have they all recalculated it already?
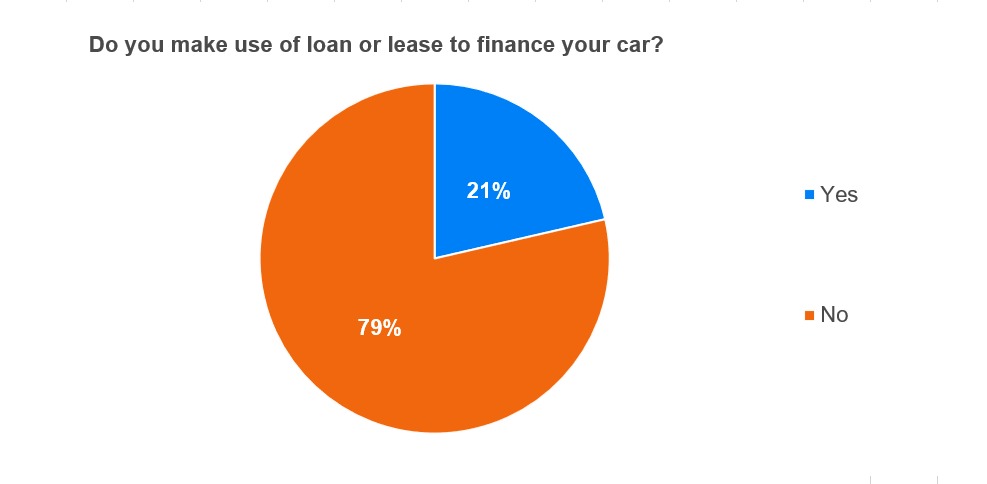
Very few of our clients make use of loans or leases to finance their car. Of those who were buying a new car, it was exactly 40%. I haven't found statistics for Slovakia, but in the US, it is 85% and in the UK it is over 90%. In this regard, encouraging results can be seen.
Once again, I would like to thank everyone for filling out the questionnaire.
In collaboration with renowned Polish professor Krzysztof Waliszewski, we have published a survey on how the pandemic has affected your personal finance. We thank all the participants who took part in the survey. You can read about the study's results in our blog: During the pandemic, we spent less and invested more.


 App Store
 Google Play

 Difficulty


