


 Difficulty

In general, even a small statistical advantage can result in a great performance. However, the time horizon plays a crucial role. If we can make use of the statistical advantage in the long run, its effect will be much more pronounced. A typical example of this is passive investing in stock indices.
In a previous article on probability, we explained to you what patterns can be found in repetitive random phenomena with exact potential results.
Today, we will have look at how these statistical rules can be used in the investment world and how they work when combined with passive investing. We will show you why a long horizon is a condition that is necessary for successful investing and how probability plays in favour of your wealth.

The development of the S&P 500 index since 1928 is a sufficiently long period which also includes numerous stock market corrections. The chart only depicts a price index that does not include dividends, on the other hand, it also omits various fees that an investor may encounter when investing in an ETF. Let's have look at the evolution of daily changes during this period.
If we try to statistically describe such time period, we will come to the conclusion that it is a random variable. In a short period of time, profit and loss are almost as likely.
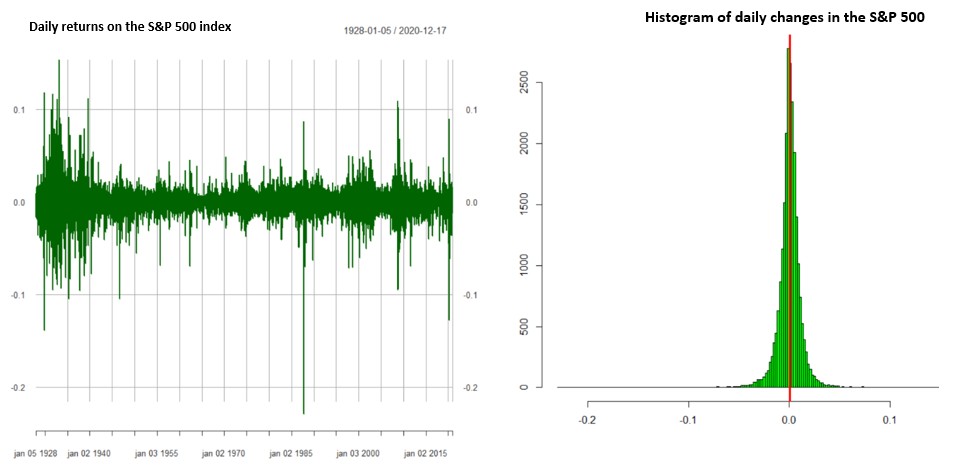
The daily returns on the S&P 500 index are sometimes positive and other times negative. In the chart on right, the daily movements of the index are arranged by size, where a value of 0,1 represents a change of 10%.
The chart clearly depicts that the returns cluster around the mean value - the average (vertical red line in the right chart). The values most often occur near this mean value.
There are far fewer values to the left or right of it. At the same time, the more we divert from the mean value to one side or the other, the less frequent the occurrence of these extreme values is.
These daily changes in the S&P 500 index differ from the mean value to some extent upwards/downwards. If we average out these deviations on both sides, we get a value called the standard deviation and it is important for estimating the future development of the index.
The mean value and standard deviation enable us to model future index scenarios. We will present the result in the form of a change in the value of the initial investment of $ 1 depending on the number of business days.
The mean daily return of the S&P 500 index between the years 1928 and 2020 is + 0.02% (average daily change of the index). It's a very small statistical advantage that we probably wouldn't even notice on an account balance. We can also observe this on the chart of daily changes of the S&P 500 as the vertical red line (mean value) is slightly to the right of zero.
The standard deviation of the daily changes of the mean value for the S&P 500 index in the given period is 1.2%. This number represents that approximately 68% of daily changes in the index are ranging from (0.02% - 1.2%) to (0.02% + 1.2%), i.e., in the range of -1.18% up to 1.22%.
What does probability say about investing in stocks for 25 days?
Knowing the the mean value and standard deviation of daily returns, let's have look at how the price of the S&P 500 index (in the form of a one-dollar investment) might fluctuate over the next 25 days.
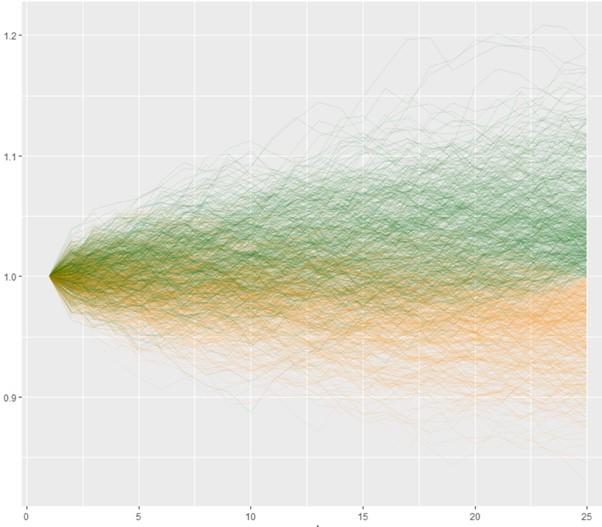
As you can tell from the picture, estimating the development of the index for the next 25 days is difficult. Using statistical values from the previous 92 years of the S&P 500 index development, we simulated the possible development 1000 times.
Results range from an appreciation of approximately 19% to a loss of -17% in the most extreme cases. The number of scenarios in which we would achieve a positive result is 570 and a negative result is present in 430 cases. The average return on investment in this period is 0,60%.
In a short-term horizon, it is quite difficult, even impossible, to predict the development of stock markets. The investment might often result in a loss. The power of passive investing lies in investing over a long-term horizon. This will be seen in the simulations of development that use a higher number of trading days.
What results will be achieved after one year?
What would the portfolio look like if we invested in the S&P 500 index for 250 trading days (approximately one calendar year)?
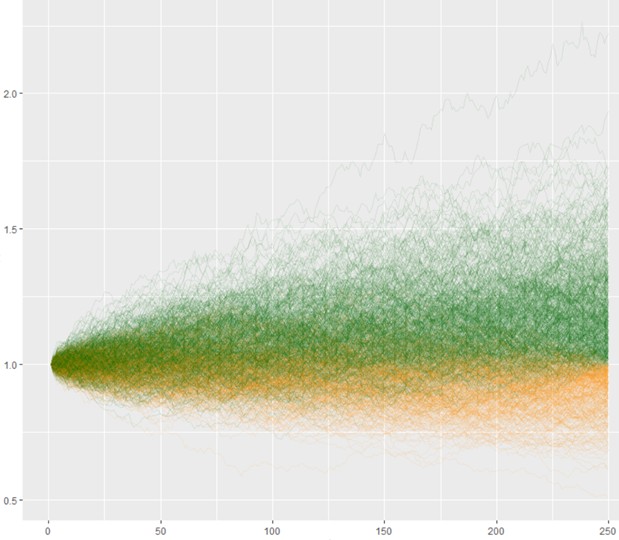
In this case, the number of results that ended up being positive (green colour) is slightly larger in comparison to the previous case. However, the probability of loss is still not negligible.
Of the 1000 simulations performed, 630 ended up being positive and the rest 370 negative. However, we can see that with increased time, the number of positive results in the simulations increases.
After approximately one year of investing in the S&P 500, in dollar form, we can easily achieve a 100% appreciation (the highest green line), but also a 50% loss (the lowest orange line). It should be noted that both of these cases are extremely unlikely to occur.
On average, we can expect our investment to appreciate by 6% after a year (not taking into account dividends and their reinvestment).
Passive investing, however, is a marathon. Its strength lies in the fact that the investor does not speculate in the short term, but invests funds for at least a few years.
Transfer your investments to us and we will manage 50% of the transferred investment for free for 2 years.
Transfer your investment to us and we'll reward you by managing 50% of the amount of the carried forward investment for 2 years free of charge.
If we invest for decades ...
Let's have look at the expected simulations’ development of investing in the S&P 500 index for 5,000 trading days (approximately 20 years).
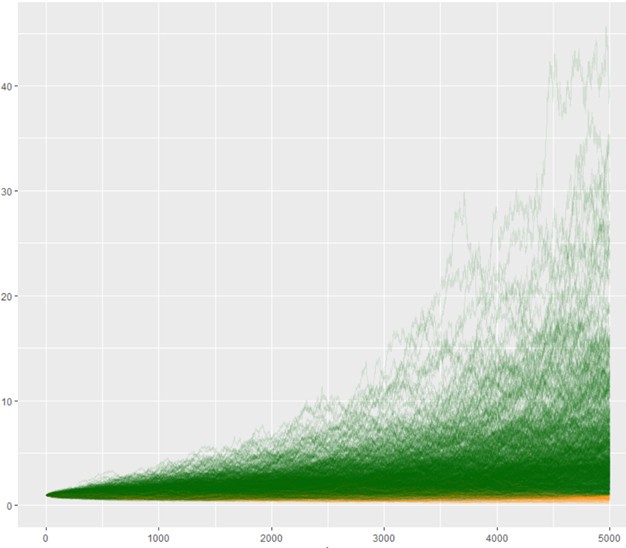
Now the effect of long-term passive investing can be clearly seen.
At the first glance, it is clear that after 20 years, the number of positive results clearly exceeds the negative ones. To put in in perspective, after 1000 simulations, 912 scenarios were positive and only 88 were negative.
On average, we can expect the investment to more than triple. In exceptional cases, it is even possible that such an investment can increase its value twenty times.
However, there is also the possibility of loss, the probability of which decreases significantly with increased investment horizon. With an investment horizon of more than 20 years, this chance is extremely small.
If we continued with the simulations and increased the number of trading days, the probability of positive results would further increase. In the end, we would only receive results for which we would not find any simulation with a negative total return.
A look into the past
What would similar simulations look like in past and comparison with the actual developments over the next 20 years?
1960
- Monitored period of daily returns: 1928-1960
- The average estimated appreciation result of USD 1 after the next 5,000 trading days: USD +2,15 (115% excluding dividends)
- Number of positive outcomes in simulations: 77,3 %
- Number of negative outcomes in simulations: 22,7%
- Actual outcome after the next 20 years (as of 1.1.1980): USD +1,80 (80% excluding dividends)
1980
- Monitored period of daily returns: 1928-1980
- The average estimated appreciation result of USD 1 after the next 5,000 trading days: USD +2,09 (109% excluding dividends)
- Number of positive outcomes in simulations: 78,1 %
- Number of negative outcomes in simulations: 21,9%
- Actual outcome after the next 20 years (as of 1.1.2000): USD +13,61 (1261% excluding dividends)
2000
- Monitored period of daily returns: 1928-2000
- The average estimated appreciation result of USD 1 after the next 5,000 trading days: USD +3,09 (209% excluding dividends)
- Number of positive outcomes in simulations: 92,3 %
- Number of negative outcomes in simulations: 7,7%
- Actual outcome after the next 20 years (as of 1.1.2000): (as of 1.1.2020): USD +2,20 (120% excluding dividends)
Looking back, we can see that the percentage of positive and negative outcomes was a good indicator for the actual appreciation in the next 20 years.
In all three periods, positive appreciation was achieved. In two of those periods, the expectation was near the expected result (based on the mean value of daily changes). In one case, the actual outcome was significantly better than the one expected.
Conclusion
A small statistical advantage, when applied to thousands of trading days, can lead to a great result. Passive investing in stock indices enables you to make use of this statistical advantage to build your wealth.
In a short-term horizon, it is difficult to determine the direction of the stock market. For this reason, short-term investing is called speculation. However, if we invest regularly over a long-term horizon, we will most likely achieve a significant positive appreciation.
Disclaimer: The original blog version of this was published in early 2021, but since the topic of passive investing is always timely we decided to modify it slightly to maintain the original calculations.


