


 Difficulty

On January 10, 2023, Finax celebrated its 5th anniversary of incorporation. With this anniversary comes a new obligation. As we have been offering Intelligent Investing portfolios for more than 5 years (the first client deposit was invested on 21 February 2018), the regulation requires us to report on the actual achieved performance.
Until now, we have mainly used modeled performance in our communications. Its main advantage has been the ability to work with historical returns going back to well before Finax was founded. We have described the detailed method of its calculation in this article.
However, this does not mean that the method is inaccurate. It offered a very reliable picture of the actual performance of client accounts, as you will be able to see for yourself at the end of this article. Nevertheless, for the sake of maximum accuracy, we will henceforth use mainly actual performance achieved in our communications.
Since the launch of Finax, we have promoted maximum transparency. We will therefore take you through the process of how we chose the new calculation method and arrived at the figures in the performance tables.
Choosing the calculation method
We can determine the actual performance achieved in two ways: by averaging the accounts of all clients or by calculating the development of a typical portfolio using the prices at which we have executed trades in the past. We have chosen the second approach.
This was mainly due to the administrative complexity of averaging all accounts. Our clients have 60,000 open accounts. In 2022 alone, they made more than 470k deposits and thousands of withdrawals, paying a different effective fee on each account thanks to various discounts and the Elite program. Averaging that many numbers would be systemically demanding and create room for error.
Therefore, we decided to calculate the evolution of portfolios where all transactions take place on actual trading days and at the actual realized prices of our clients' purchases and sales.
As a result, their performance will be the same as the actual performance achieved by the standard portfolio with the full fee. Minor differences may only occur due to less accurate rounding in our trading system.
Please also note that the performance achieved also depends on the individual client. Many of you achieve higher returns due to discounts or Elite membership. Moreover, the exact initial allocation and timing of rebalancing depend on the investment start date.
Methodology
To calculate the actual performance of the standard portfolio, we proceed as follows:
- Investment in the Intelligent Investing portfolios starts on 21.2.2018, for the Intelligent Wallet on 27.7.2021. In both cases, this is the date we made the first ETF purchase on these strategies.
- All purchases and sales (e.g., on first investment, rebalancing, or divesting due to the need to replenish cash in the account) are made exclusively on purchase days (usually Tuesdays) at the actual prices of trades made during that date.
- For the first purchase, funds are allocated according to the optimal (initial) allocation for each portfolio. You can see the specific numbers in the tables below.


- We calculate the subsequent development of the account value on a daily basis. For this, we use the closing prices of the individual ETF funds as reported by our custodian in the Finax client accounts, i.e. the prices valid at the close of trading on the exchange at the end of the business day.
- We apply the full fee including VAT to all portfolios. This is 1.2% per annum for Intelligent Investing strategies and 0.5% per annum for the Intelligent Wallet and Smart Deposit .
- The calculation of the amount of fees takes place every day, including weekends. At the end of the month, the daily amounts are added up and deducted from the retained cash.
- The initial cash share in the Intelligent Investing portfolios are 1.5% and in the Intelligent Wallet and Smart Deposit portfolios are 0.6%. This proportion is gradually declining due to the charge of the fee.
- From the launch of the portfolios until 19.2.2024, as the cash share falls below -0.5%, a proportion of each portfolio position (around 2% of each position, per ETF) is sold proportionally on the next trading day to bring the cash share to the original 1.5% of the portfolio value (0.6% in the case of Intelligent Deposit and Smart Wallet), while maintaining the securities allocation from the end of the previous day. Such cash replenishment takes into account the time test required for tax exemption (1 year for Slovak tax residents). The divestment can therefore only proceed after this period has expired.
- As of 20.2.2024 we have adjusted the minimum cash share in the value of the account to -0.3%. From this date onwards, cash is therefore added back to the original proportion after this threshold has already been exceeded. As before, the divestment takes into account the time test necessary to avoid a tax liability.
- We also track the deviation of the weights of the individual ETFs on every investment day. If the deviation exceeds the permitted limit, the account will be rebalanced. This blog will reveal more about the method and beneficial impact of rebalancing.
- Performance is calculated as the percentage change in the value of a portfolio over a period of time.
Comparison with Modeled Performance
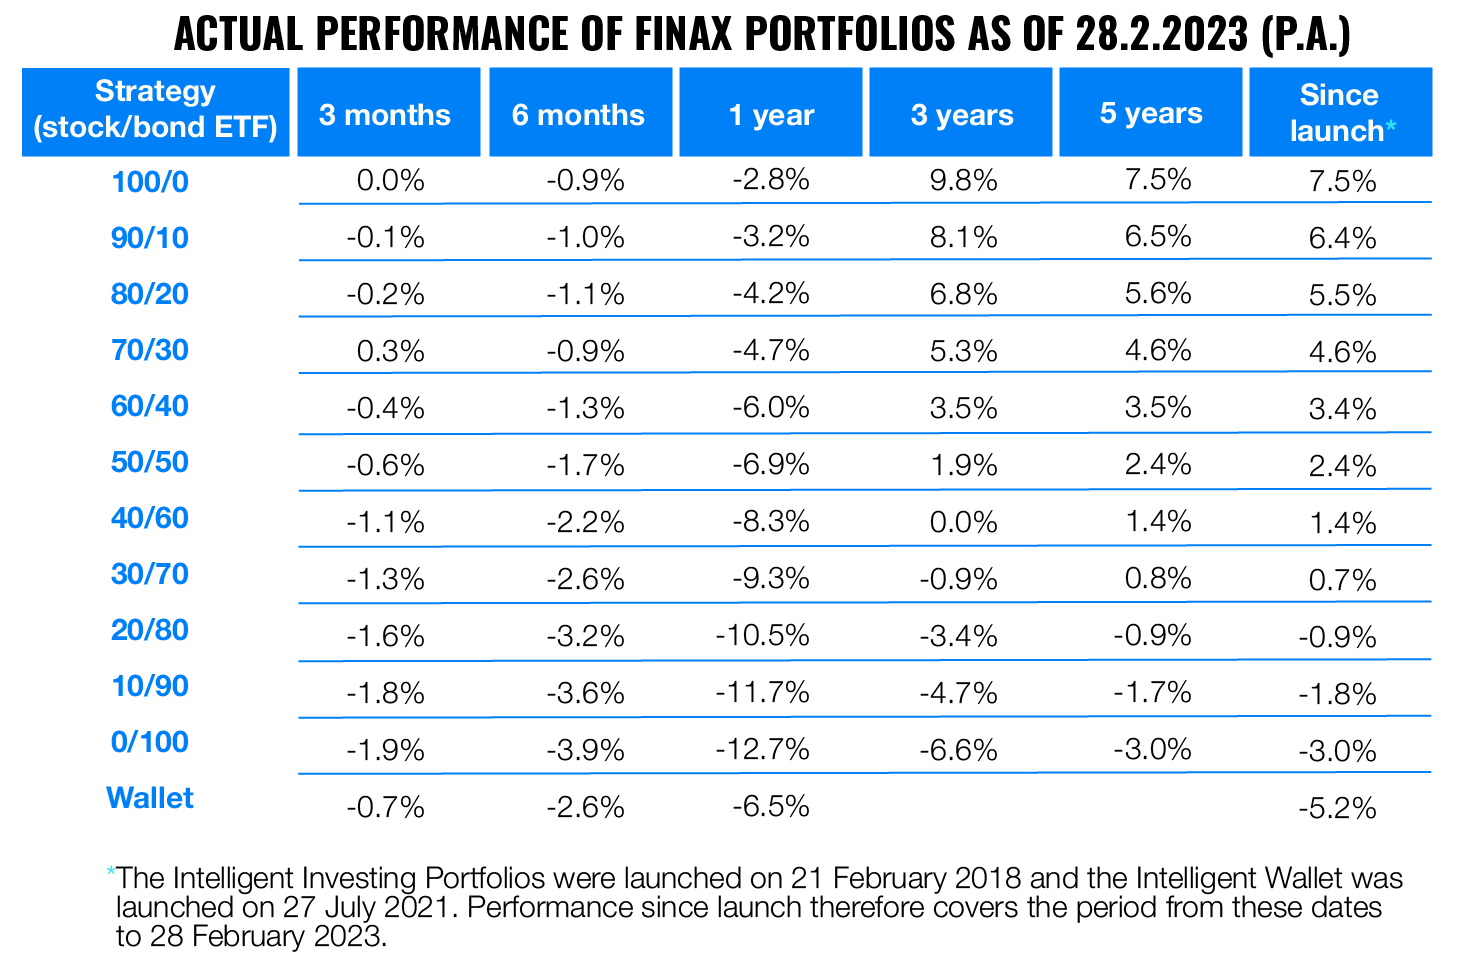
The actual performance of each strategy can be found in the table below. The figures are current as of 28.2.2023.
Note on the data presented: Past performance is not a guarantee of future returns and your investment may result in a loss. Please be aware of the risks you are taking when investing.
For comparison, we also include a chart showing the development of the 100% equity portfolio. It displays a comparison of the actual performance achieved and the modeled development (which we used until the end of 2022). The period covered ranges from the end of February 2018 to February 2023. You can see that the modeled performance mirrored the actual performance with only small deviations.
Note, however, that both performances, do not guarantee the future evolution of your investment.

The reason for the slight deviations is due to a few differences in the calculation method. The modeled portfolio uses end-of-day closing prices for purchases and sales, which may differ slightly from those at which actual trades took place during the day.
In addition, it does not determine the fee on a daily basis, but on the average of the opening and closing values of the portfolio over the last month. Rebalancing does not take place on the next trading day but at the end of the month.
We hope that the information in this article will help you to more easily understand the tables disclosing the performance of our portfolios. Remember that many clients are achieving higher returns due to the multiple discounts offered.
Most recently, we have increased the discount for inviting friends to €1,000 managed for three years at no charge.
Last year we also increased the investment transfer discount. If you document an investment exit with a competitor and invest the funds at Finax, we will manage 50% of the transferred value for 2 years at no charge.
Also, feel free to reach out to us at [email protected] if you have further questions about calculating actual performance. We will be happy to clarify further details or provide you with the exact calculations that led to the results in the tables.


