


 Difficulty

Financial markets entered the new year in an environment of general uncertainty. Inflation was still at several times the central banks' target, many analysts expected corporate profits to fall and economies to slide into recessions due to expensive energy and high interest rates. Many investors, therefore, thought that markets would find new lows.
During the first 6 months of this year, most of the pessimistic predictions did not materialize. At the beginning of the year, European indices rose thanks to a mild winter, falling energy prices, and the reopening of the Chinese economy. Later, US indices started to rise sharply thanks to falling inflation, the resilience of the economy, and investor enthusiasm for AI. Although they are still below their previous highs reached in 2021, they are well on their way to recovery after the first half of the year.
We have also started to see signs of recovery in the bond market, which, however, continued to be pushed down by interest rate hikes by central banks. However, as inflation has dropped, there is likely to be room for a slowdown or even a complete halt in interest rate hikes. The pressure on bond markets could thus disappear, allowing them to gradually start rising thanks to the pay-out of the current high yields.
Once again, it has been confirmed that cautious optimism pays off when investing. If you stay invested at all times, you are guaranteed not to miss the waves of recovery, instead using the dips to buy in at discounted prices.
How have mutual funds used this trend to their advantage? In a turbulent environment, have they been able to generate excess returns relative to the market or have they missed out on its growth? Take a peek at our regular comparison, where we pit the performance of the most popular mutual funds and Finax strategies against each other.
We've organised the comparison according to the European SRI risk indicator that mutual funds are required to disclose in their key information documents (KIDs). The higher this number, the more volatile the value of the portfolio (so your investment would experience sharper up and down movements).
Portfolios with the same SRI have similar risk. That’s why we have tabulated portfolios by this metric so you can compare which solution offers the most satisfactory return for a given level of risk.
If the results of the comparison convince you that your savings will be better off in Finax, feel free to take advantage of our investment transfer discount. If you document a transfer of your investment from a competitor to Finax, we will manage half of the transferred amount free of charge for two years. Learn more about the discount in this article.
Note on the Data Quoted: All data tied to the performance of the Finax portfolios represent the actual performance achieved by the sample portfolios. We have described how we calculate actual performance in the article How Do We Calculate the Actual Performance of Finax Portfolios? Past performance is no guarantee of future returns, and your investment may also result in a loss. Find out what risks you are taking when investing.
Tax Disclaimer: The tax treatment depends on each client's individual circumstances and may vary. Income from the transfer of securities (Art. 8(1)(e) of Act 595/2003 Coll. on income tax) traded on a regulated market are exempt from tax after one year from their acquisition (Section 9(1)(k) of Act 595/2003 Coll.). Income from the sale of ETFs forming the Finax portfolios meets the tax exemption conditions if they are held for at least 1 year and are not included in the taxpayer's business assets. This exemption does not apply to investors who are not Slovak tax residents. Income from redemption (redemption) of units (Art. 7(1)(g) of Act No. 595/2003 Coll.) is subject to tax. The taxation regime for Finax portfolios may change in the future. In our comparisons, we work with the net after-tax income for Slovak tax residents under the currently applicable legislation and do not take into account any rebalancing in the previous year when assessing the tax liability on the Finax portfolios. We use a 19% income tax rate to calculate the net income of mutual funds (to determine the amount of taxation of income from mutual funds).
Dynamic Strategies
Dynamic portfolios invest predominantly in stocks that have the highest expected return over the long term. In exchange, however, investors must tolerate greater fluctuations in the value of the investment compared to more cautious strategies.
Finax's dynamic strategies fall into the SRI 4 risk category. Mutual funds with similar risk have fared about the same as Intelligent Investing over the past year. Most of them have not significantly lagged the market, nor have they convincingly beaten it.
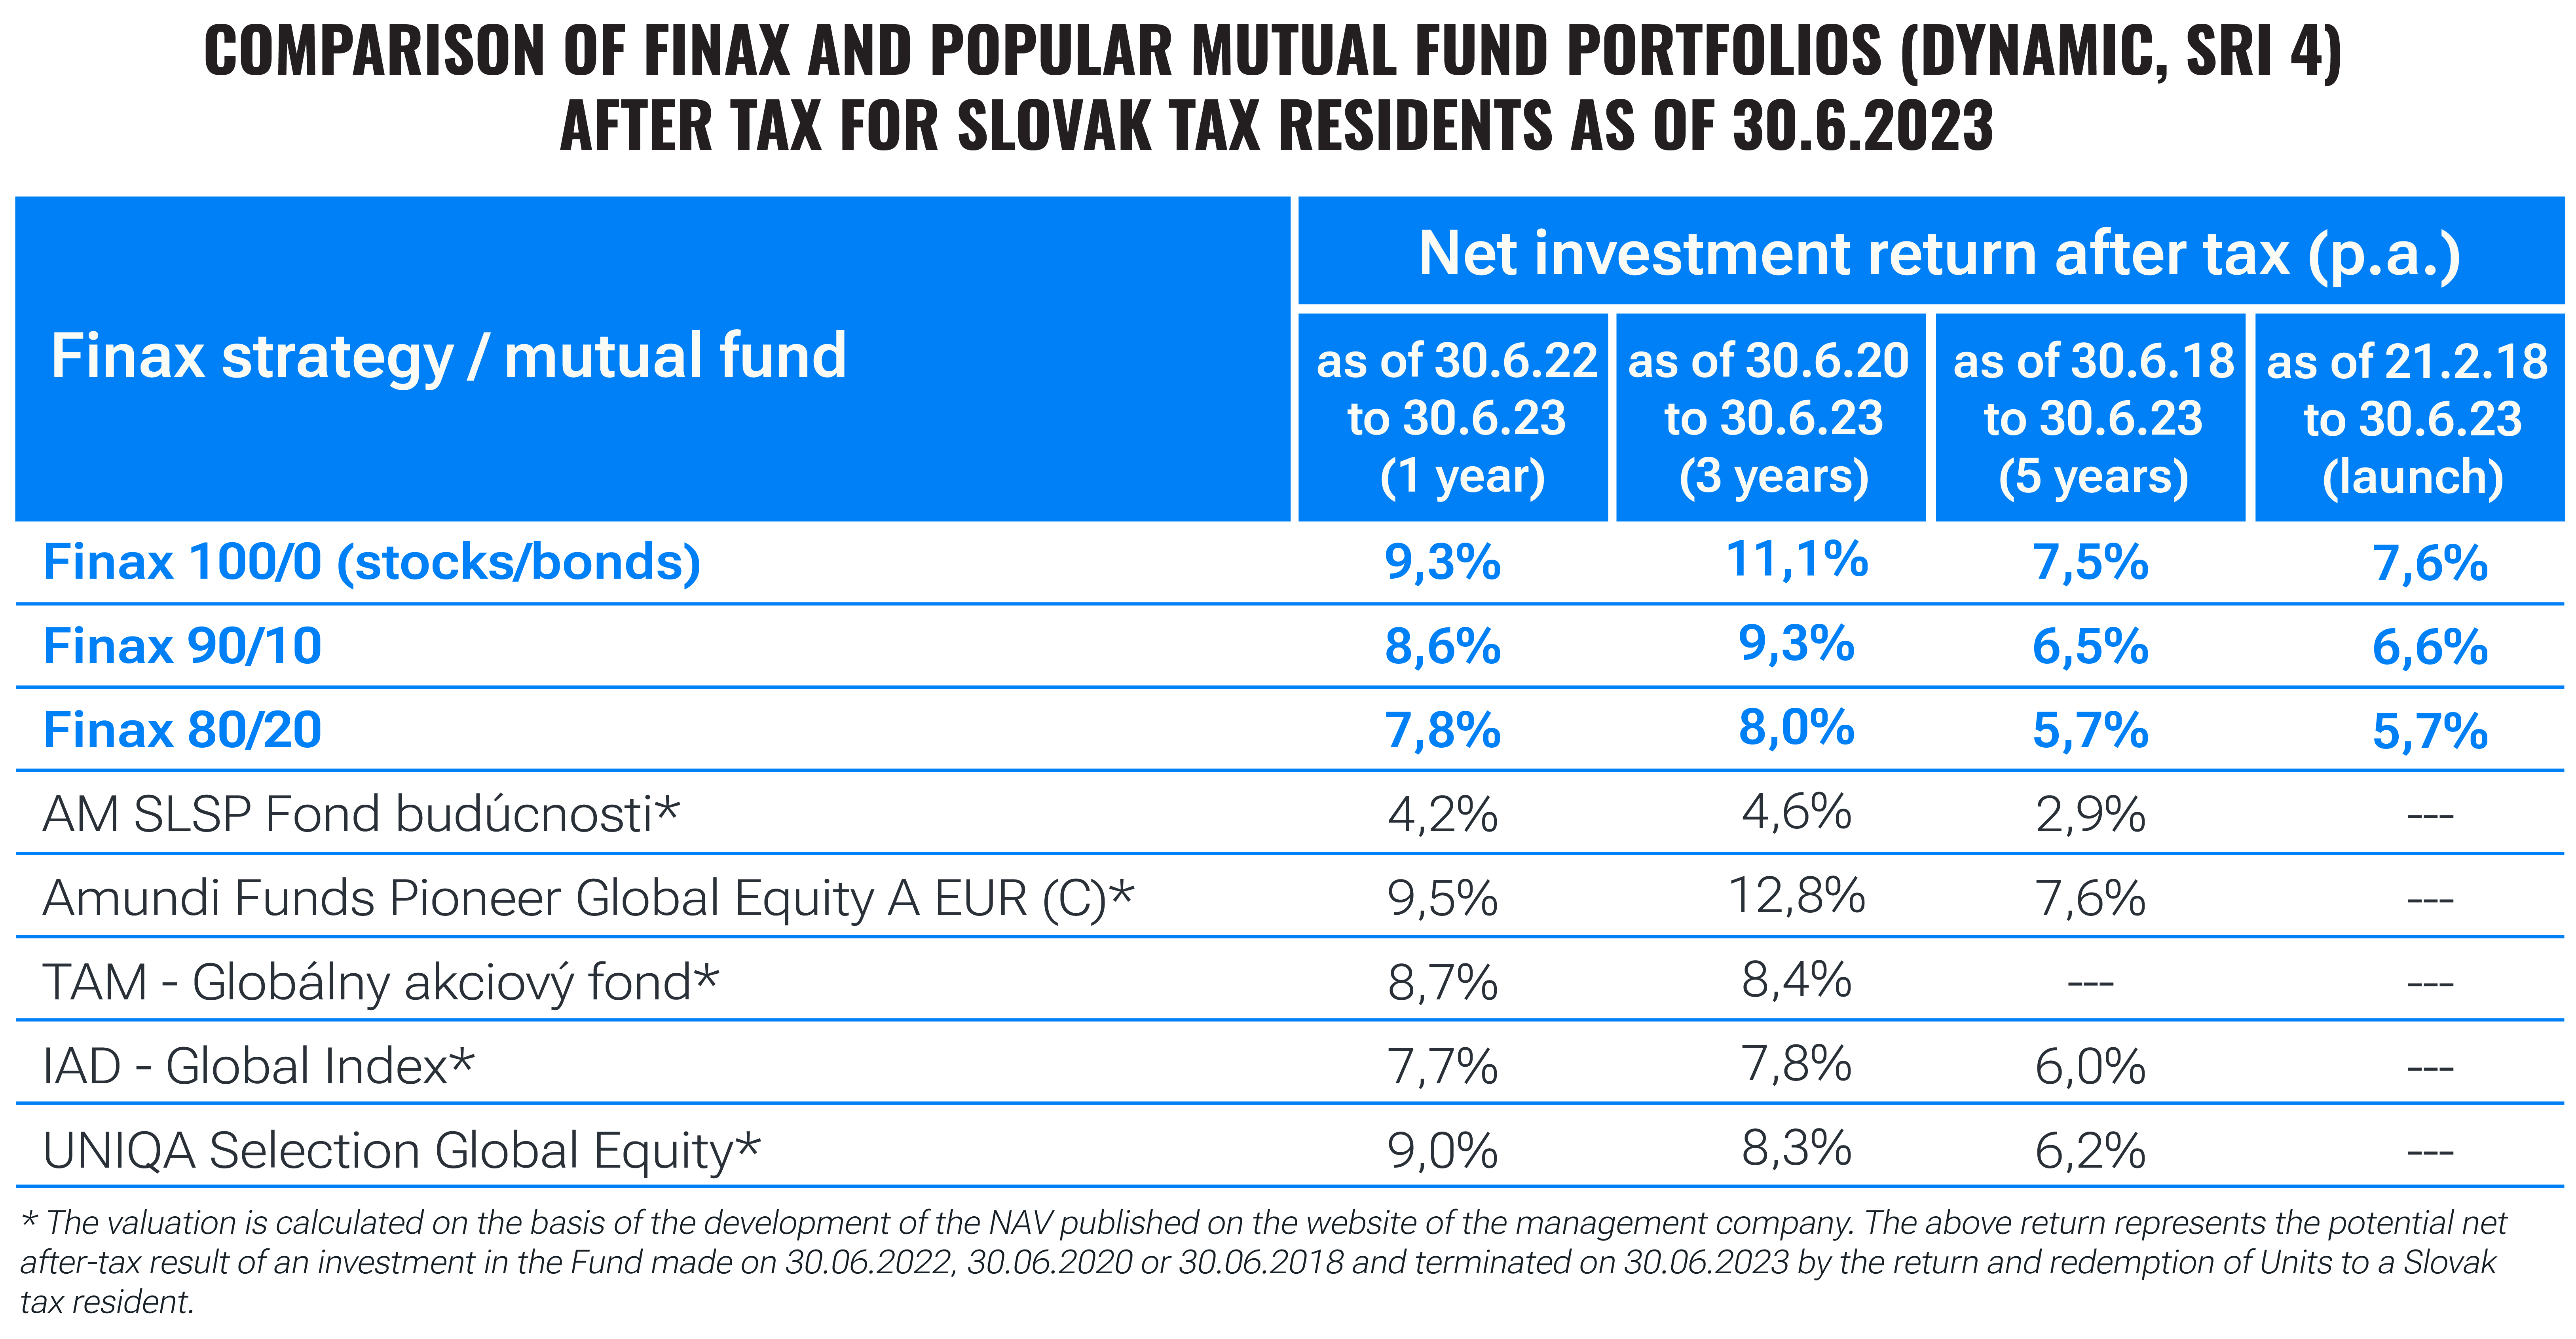
On each horizon, the average appreciation of Finax strategies is almost a percentage point higher than the average of mutual funds (e.g., on the horizon of the last 5 years, the average annual return of Finax strategies is 6.6%, while that of mutual funds is 5.7%).
The difference is mainly due to the lower fees of Finax (see the end of the article for a specific comparison of fees) and the more favourable tax regime applied to ETFs (which are tax-free after one year of holding, while mutual fund returns have to be taxed at 19% for the time being), assuming the investor is a Slovak tax resident. Purely in terms of performance before fees and tax, dynamic funds have done a decent job this year, for which they deserve credit.
More interesting is a look into the higher risk category of SRI 5. Funds in this category often hold more concentrated investments, trying to time their purchases and sales according to expected market developments. As all Finax portfolios carry lower risk (SRI 4), we will compare these funds with Finax's most dynamic solution, the 100% stock portfolio.
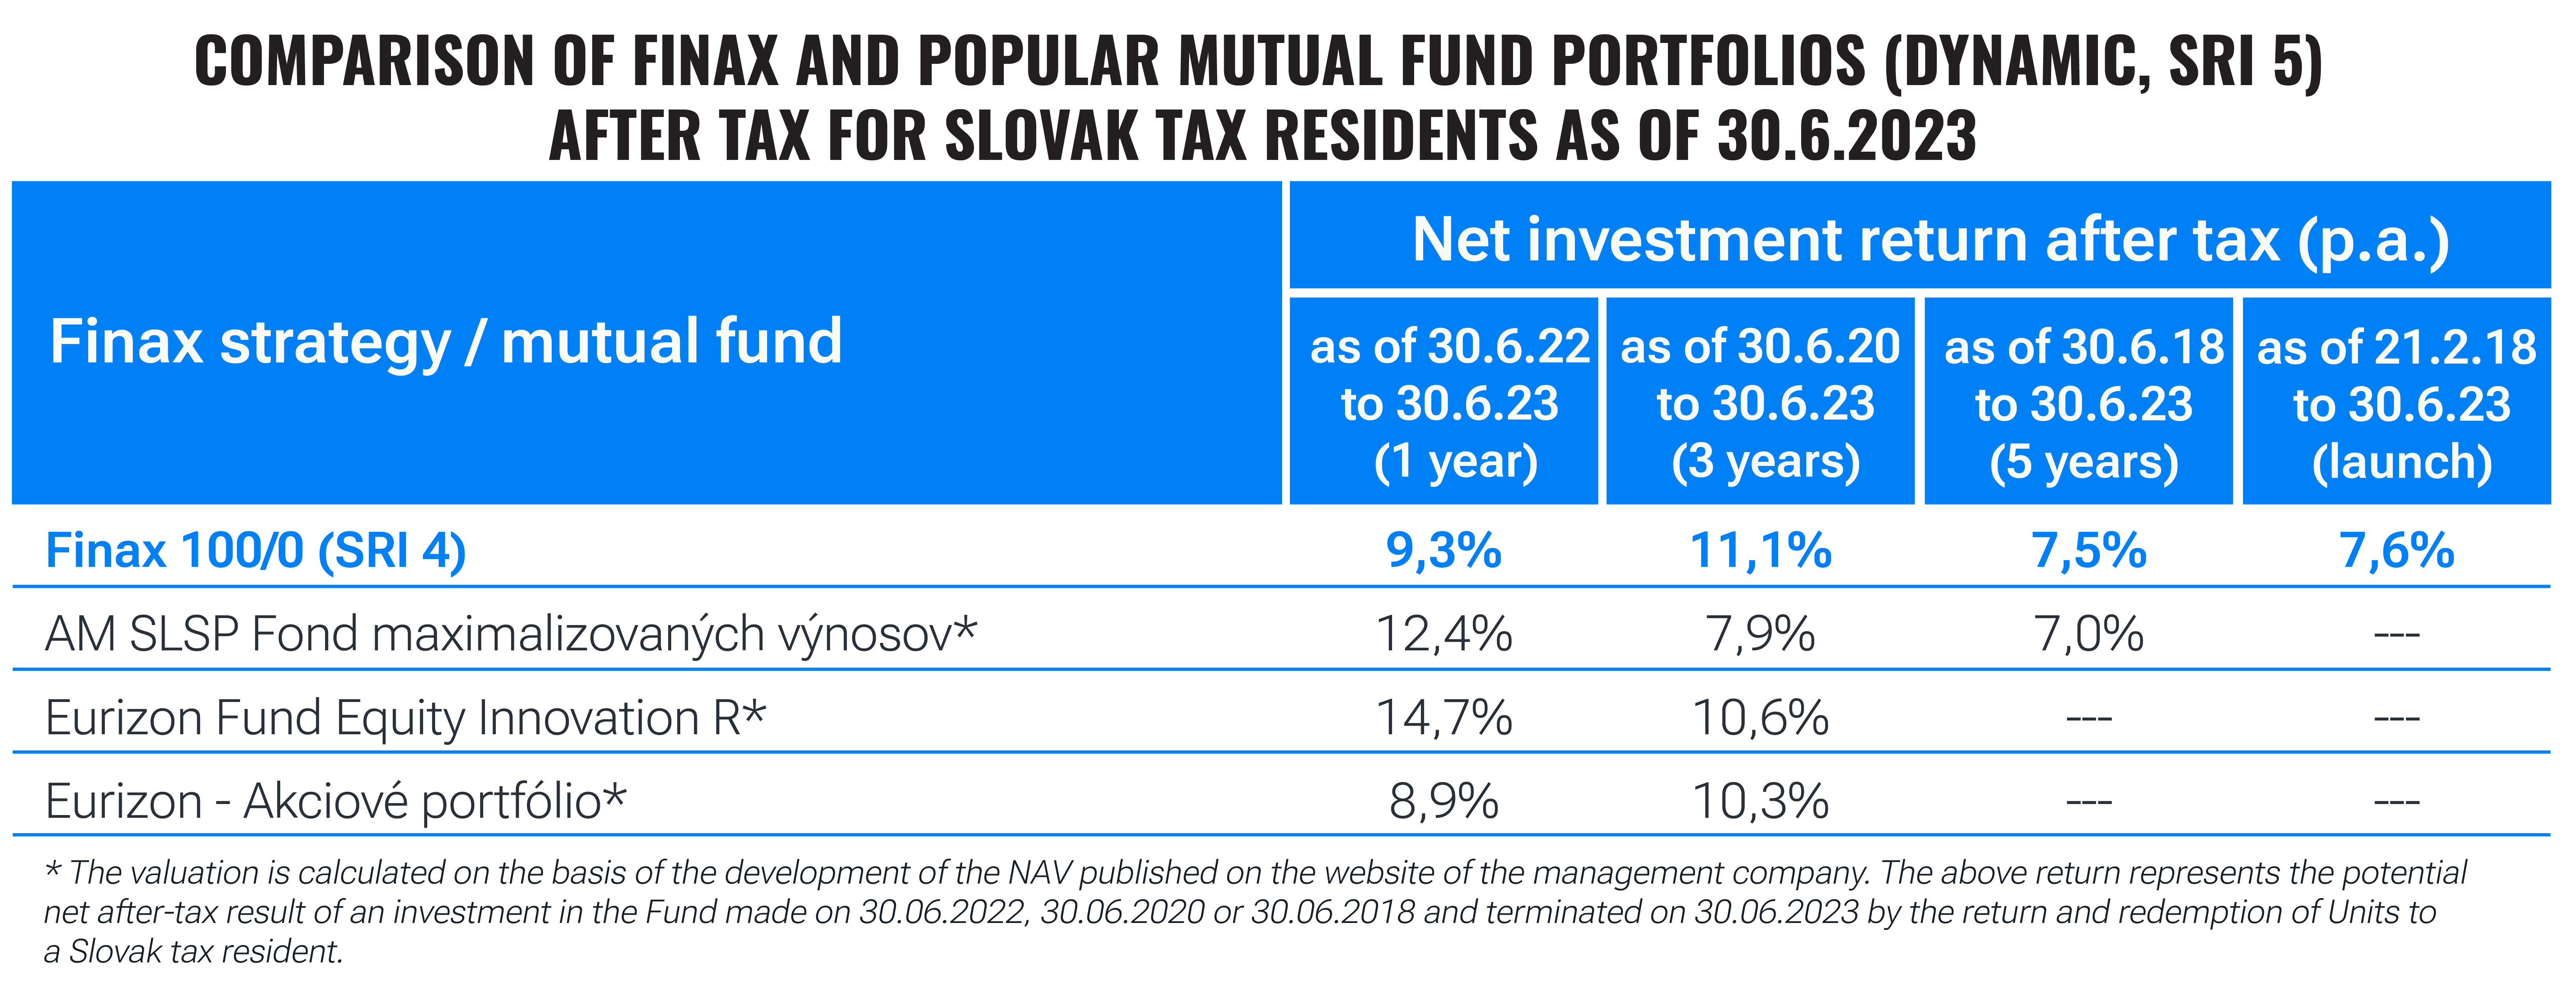
From a multi-year perspective, the funds have failed to deliver higher returns in exchange for higher risk. Over the past year, however, two funds from AM SLSP and Eurizon have managed to beat the market decently, for which they again deserve praise. Both hold a high concentration of US equities, particularly those in the technology sector (Eurizon Fund Equity Innovation R explicitly targets companies in the technology innovation space). Such investments have had a particularly successful first half of the year.

Create an account and start investing today
However, a high weighting of one country or sector may not always pay off; last year, for example, these funds declined at a faster pace than the market (as valuations of technology firms were sharply chopped by rising interest rates). This is why, despite the successful last year, they failed to beat Finax on the horizon of the last 3 and 5 years. Not a single higher risk category mutual fund beat the 100/0 portfolio on these two horizons.
This shows that holding a diversified portfolio, where you don’t speculate on timing or picking specific sectors, pays off even in turbulent periods where sharp declines alternate with massive growth. You can take full advantage of the lower fees and tax benefits that such a portfolio offers. If you have a longer horizon and can tolerate risk, the 100/0 portfolio is the ideal destination for your savings.
Balanced Strategies
The SRI 3 risk category usually has the most funds falling into it. It contains strategies with different mixtures of equities, bonds, commodities, or money market instruments. The range of returns achieved is, therefore, quite varied for both Finax and mutual fund strategies.
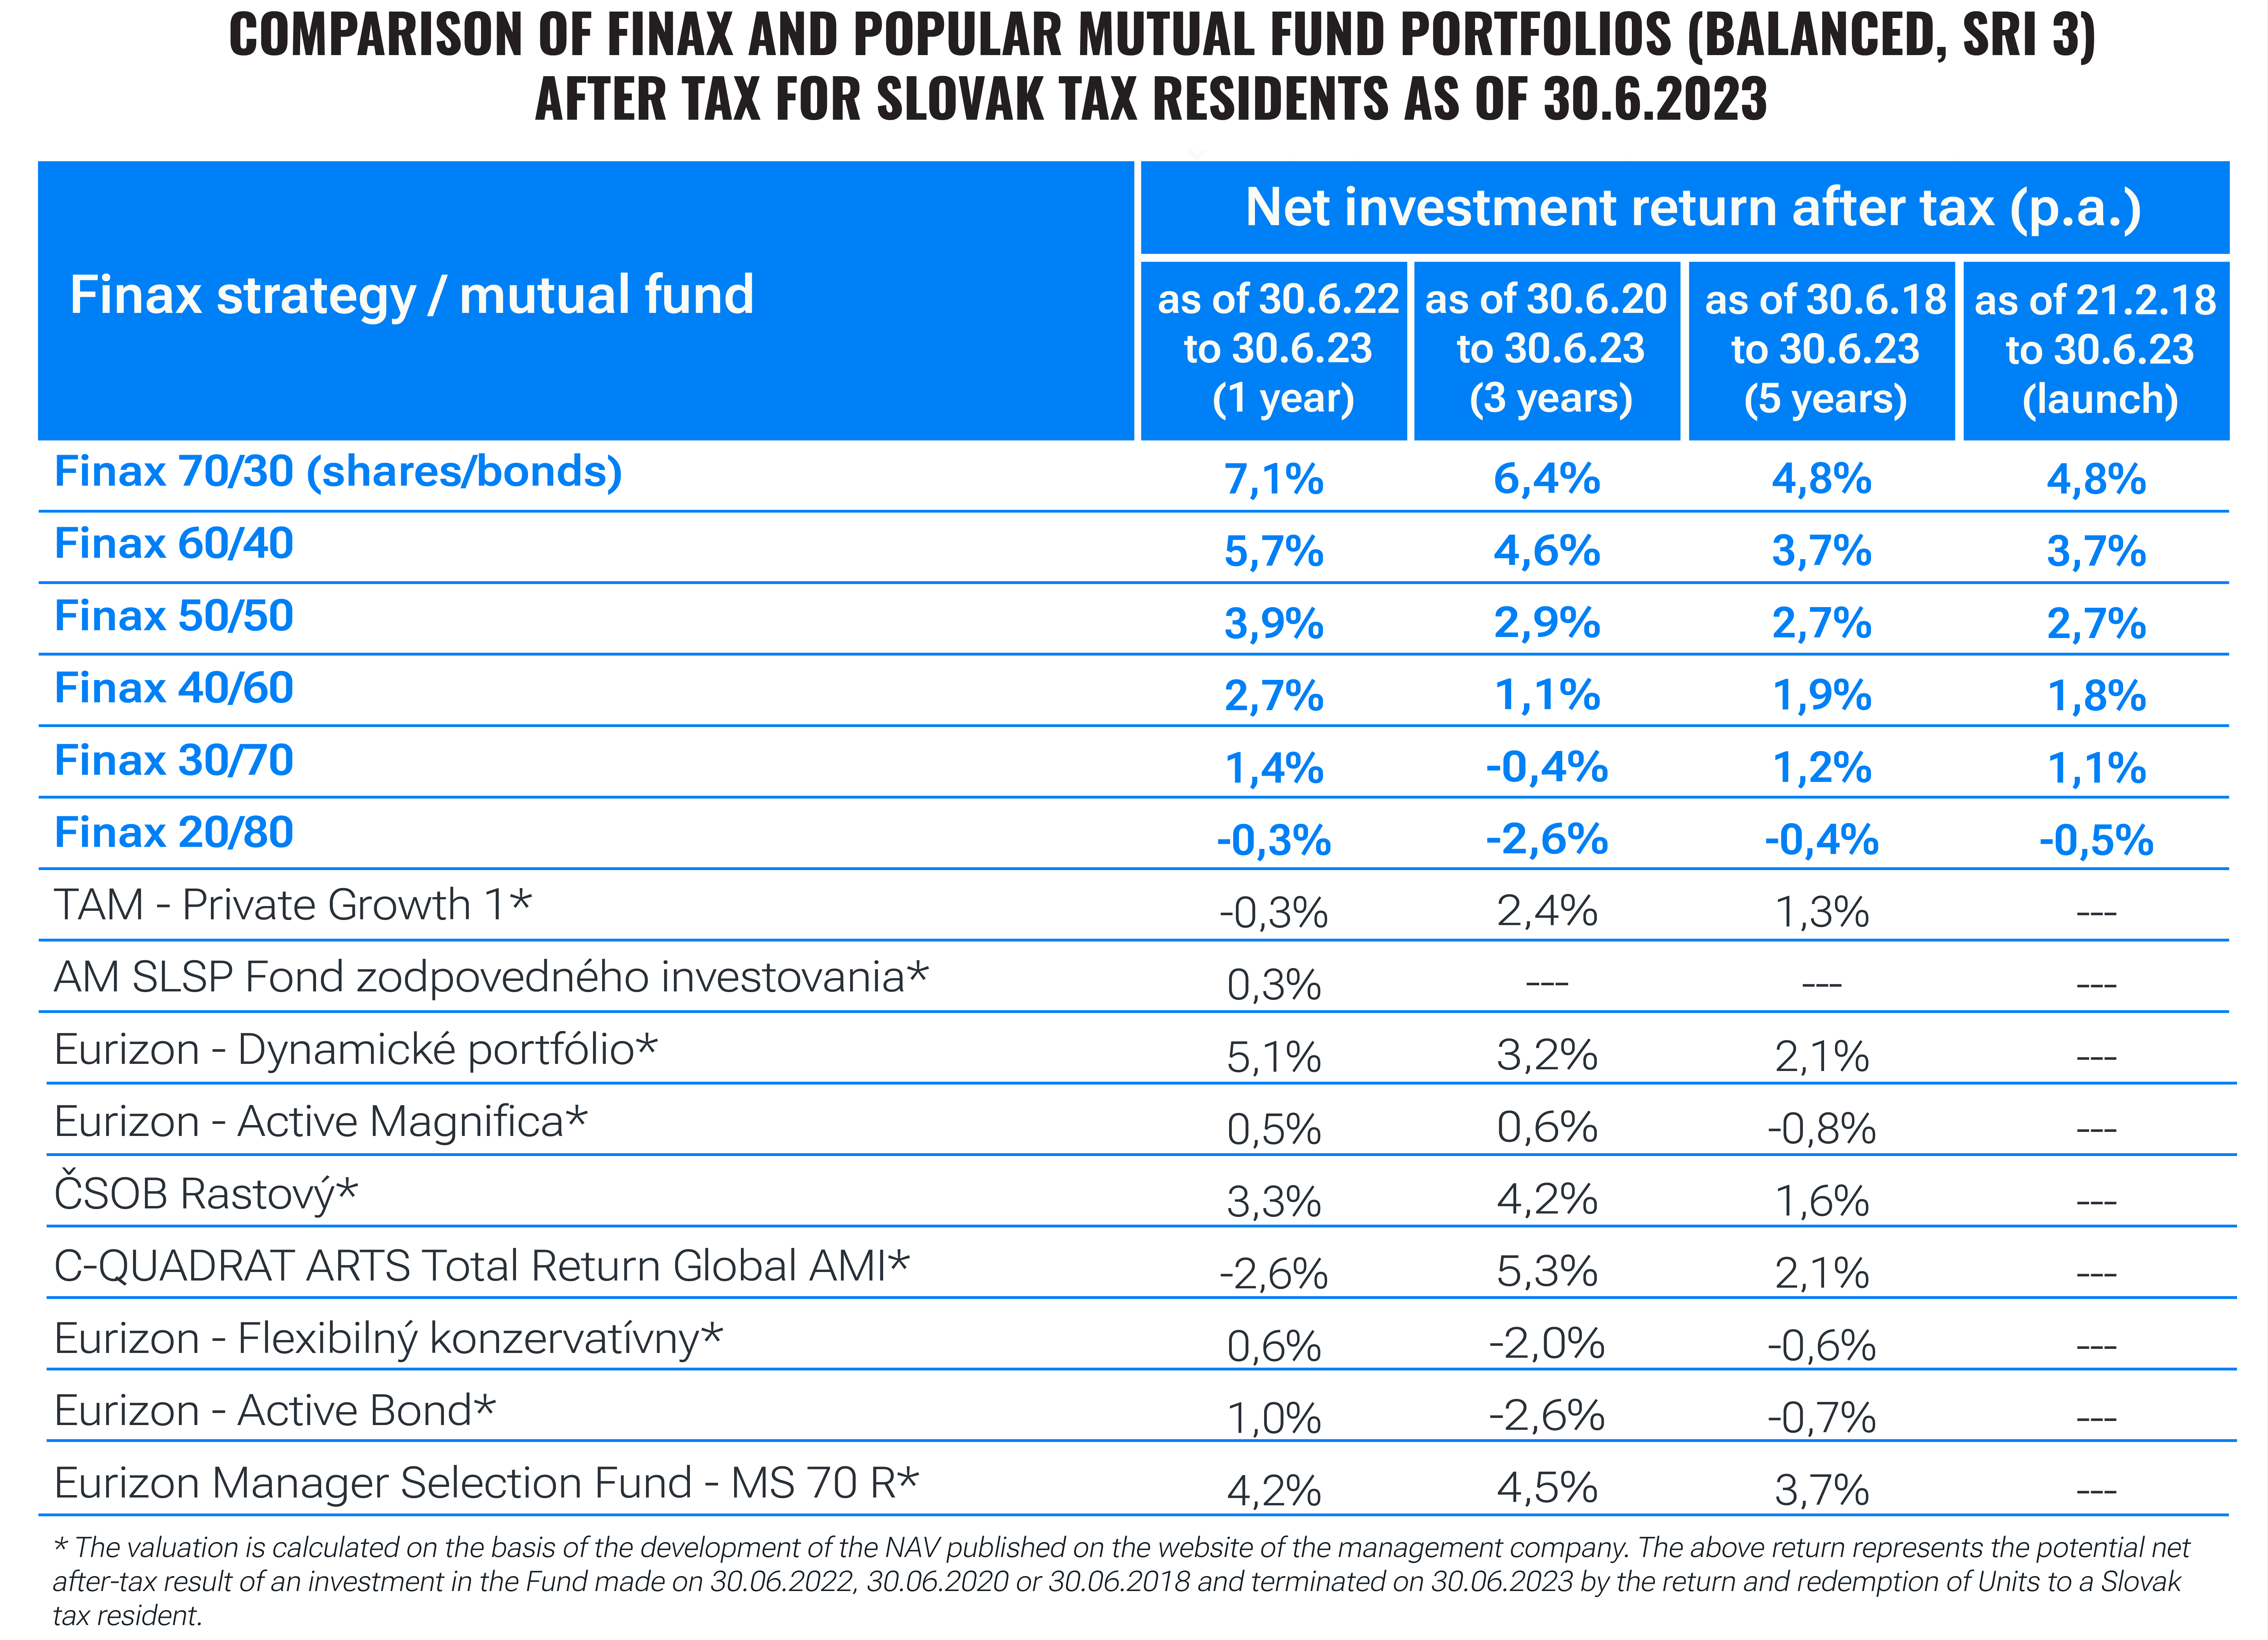
On the horizon of the last year, Finax's dominance in this category is more pronounced. Most funds have staggered around zero over this period, while most Intelligent Investing strategies have ended in a more significant gain.
The advantage does not disappear on longer horizons. Over the past 5 years, the average annual appreciation of funds in this risk category has been 0.7%, while the average of Finax's balanced strategies has been 2.3%. These figures are likely to rise further once markets fully recover (e.g., due to bond prices no longer being pushed down by interest rate hikes by central banks, as those are expected to slow considerably in the near future).
Conservative Strategies
Conservative Finax portfolios have fared the worst compared to funds, having steadily declined over the past year due to continued interest rate hikes by central banks. Several funds have also failed to avoid losses, but they were able to control them more effectively. Even on longer horizons, our bond portfolios are in a slight loss, while funds are either balancing in slight gains or are also in the red.
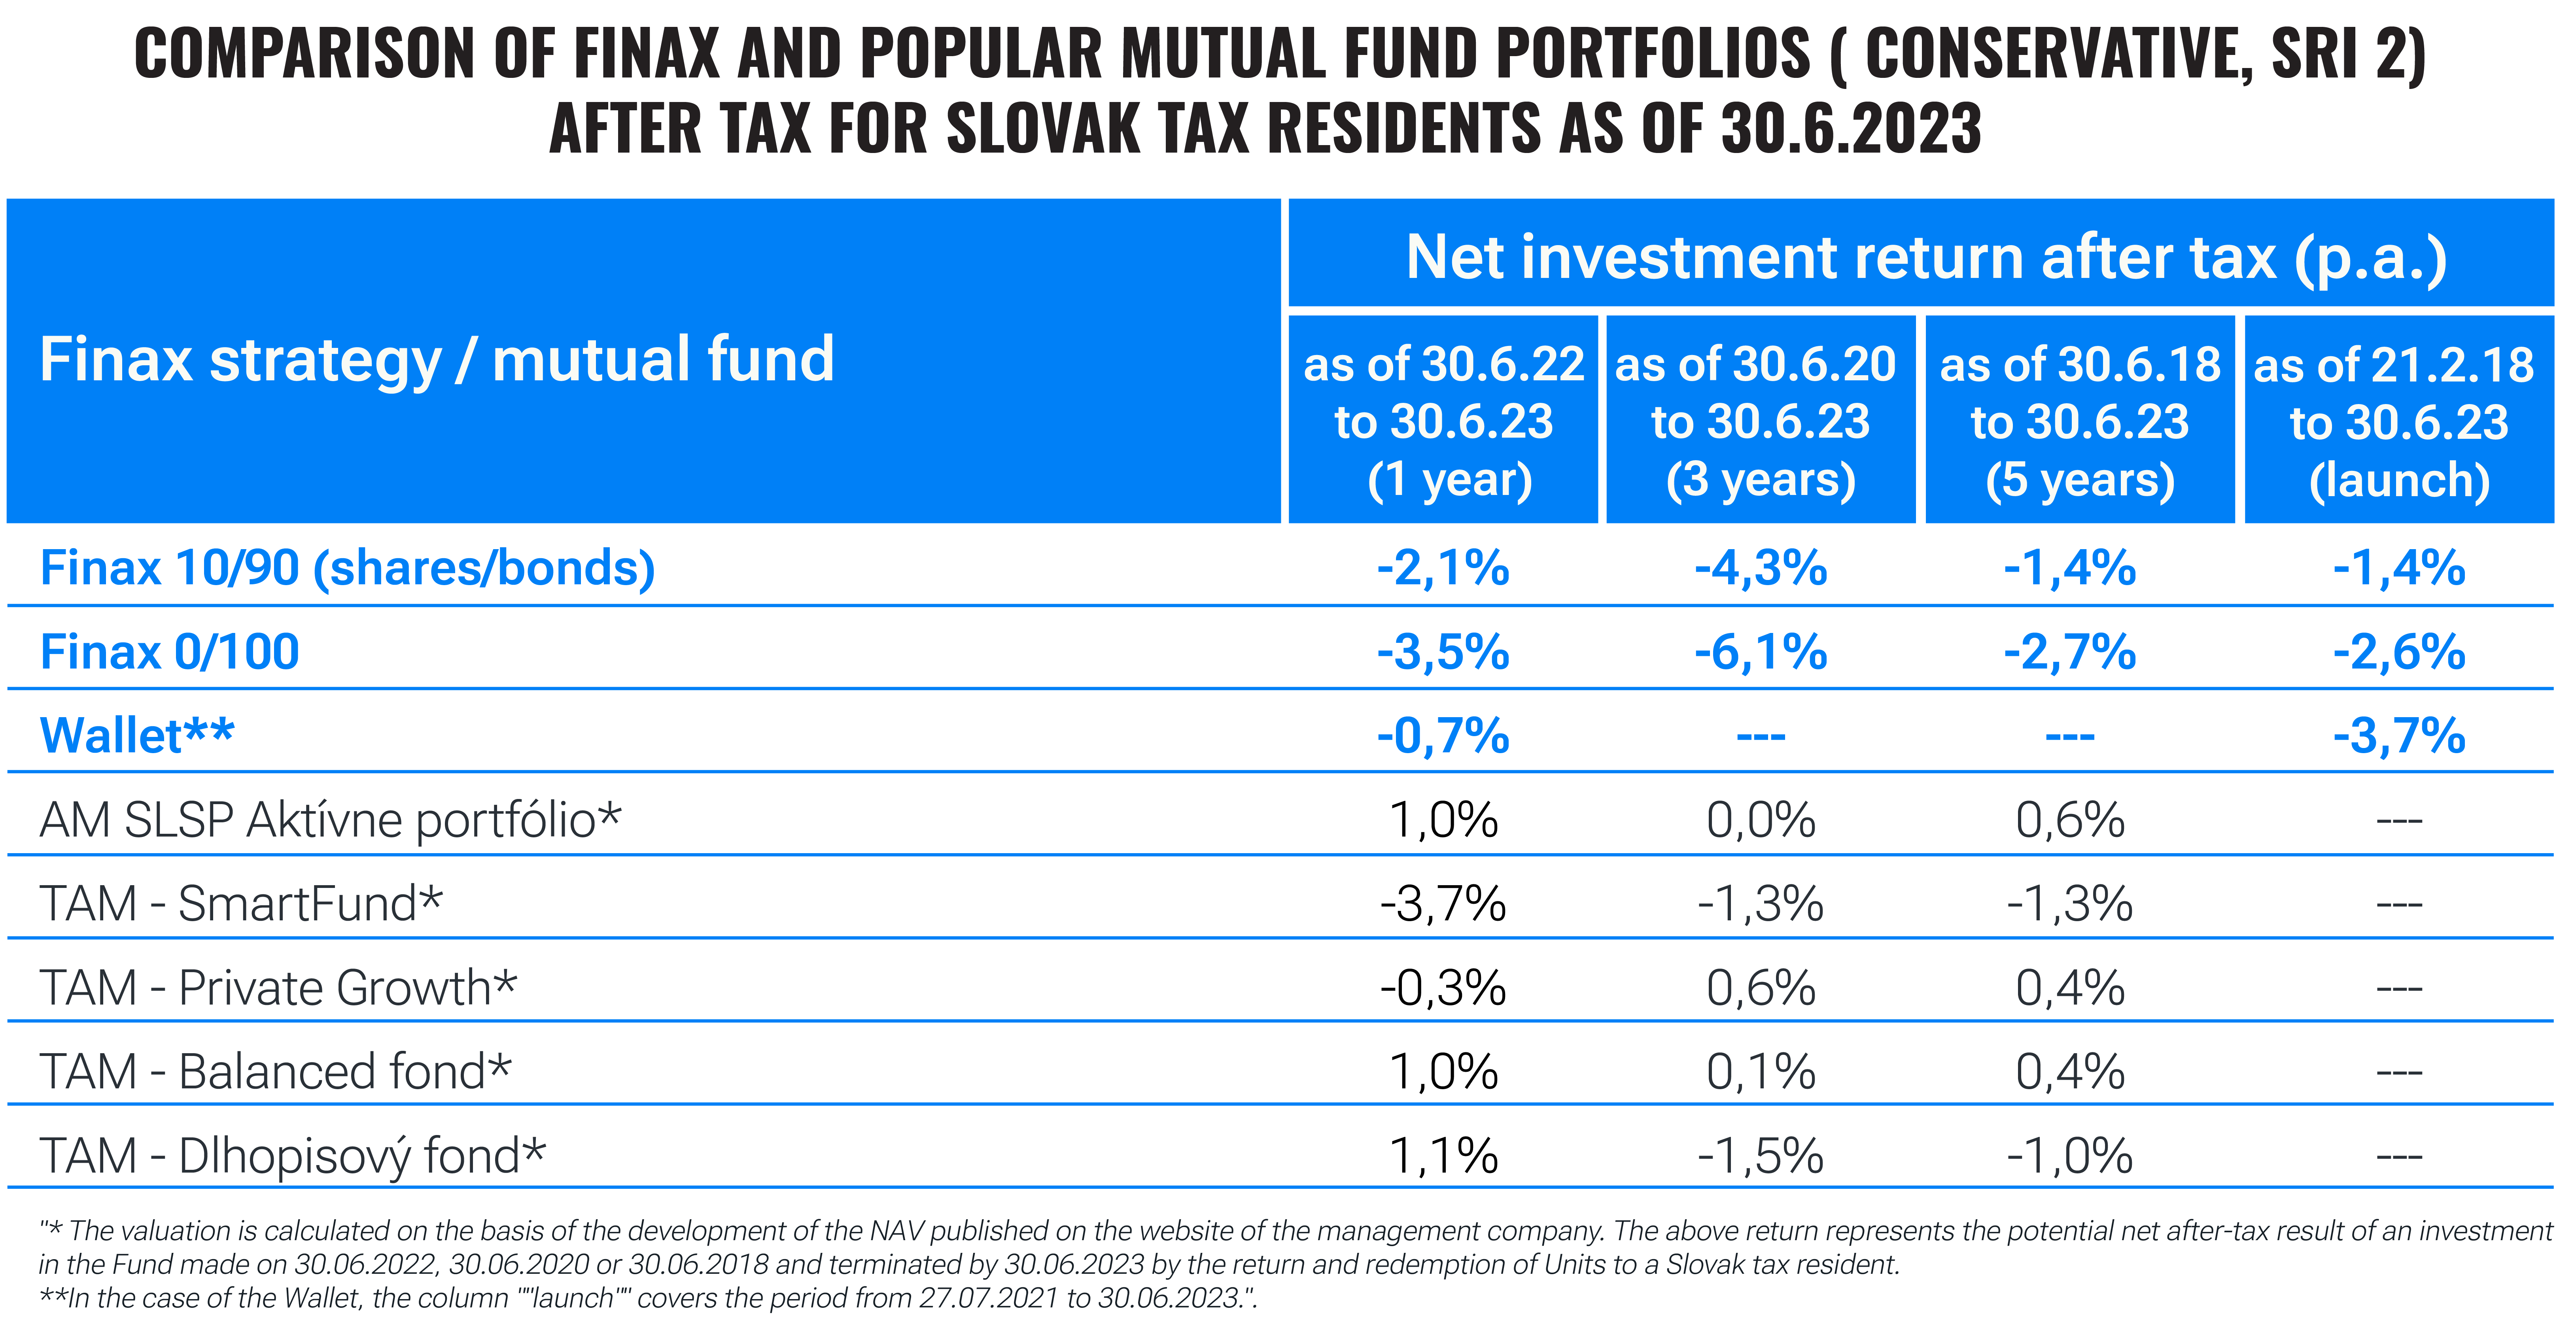
There are two factors behind Finax's underperformance relative to the conservative funds, which we have already mentioned in the past. The first is the fact that, compared to equity markets, active managers in the bond market have more opportunities to generate excess returns (due to characteristics such as precise maturity, many OTC trades with arbitrage opportunities, or a higher proportion of professional investors).
The second reason is that the bonds included in our portfolios have a relatively long duration. This indicator measures their sensitivity to interest rate increases; the longer the duration, the more bond prices will change in response to a change in interest rates. If interest rates in the economy rise, the bond prices fall; if central banks start to cut interest rates, the bond prices rise in response.
It should be remembered that the events that sent bonds into a loss happen once in a generation. We have seen the steepest rise in interest rates in history, with bond prices inevitably responding to rising interest rates by falling. This does not change the fact that, over the long term, these securities earn a return that is lower but more stable than that of equity investments.
It is precisely the rise in interest rates that has made bonds interesting after some time. Even the safest government bonds currently yield around 3-4%. However, bonds have a certain maturity, you have to give them time to gradually pay out that yield. That’s why we could see a gradual recovery over the next few years.
The increased yields are already demonstrating their effect in the short-term market, where they are being paid off more quickly. We have recently launched a new product, Smart Deposit, which is based on money-market ETFs and ultra-short bonds. It currently offers a yield of 3.3% per annum, which has translated into a gradual growth in the ETFs included in the product in recent months. Read about it if you're interested in solutions in the sphere of conservative investments.
Comparison Methodology and Selected Mutual Funds
In the blog, we compared the net performance after fees and potential taxation (for Slovak tax residents holding the investment for a period of at least 1 year) of hypothetical investments in Finax portfolios and the most popular mutual funds in Slovakia terminated as of 30.06.2023.
In the case of Finax portfolios, we also present the performance since launch, i.e., from 21.02.2018 in the case of Intelligent Investing and from 27.07.2021 in the case of Intelligent Wallet. You can read the methodology of calculating the actual performance of our portfolios here.
We define popular mutual funds as the largest mutual funds or funds with the largest net sales in the past year in each risk category. At the same time, we try to include all the key asset management companies whose services are used by Slovaks.
Download our app.
Invest quickly and easily.
We have selected 22 funds for the comparison. Unitholders' assets in these funds amounted to almost 4.1 billion euros as of 30.06.2023.
Below you will find the compared funds with the indicated ongoing fee (source documents: KIDs) and the assets under management of the fund in Slovakia (source: Slovak Association of Asset Management Companies as of 30.06.2023). The above fee includes all ongoing costs of the fund, including transaction fees.
Finax charges a portfolio management fee of only 1% p.a. + VAT (in total 1.2% p.a.). Until recently, a payment processing fee of 1% + VAT (1.23% in total) was also charged on deposits of up to EUR 1,000. We have not included this second fee in our calculations, and from 1.7.2023, we have abolished it forever. You can also reduce the portfolio management fee (even down to zero) by taking advantage of the aforementioned investment transfer discount or the discount for inviting friends to Finax.
Asset Management Slovenskej sporiteľne:
- Fond maximalizovaných výnosov, 2.01%, EUR 696.8 million,
- Fond budúcnosti, 2.02%, EUR 137.4 million,
- Aktívne portfólio, 1.66%, EUR 378.9 million,
- Fond zodpovedného investovania, 1.4%, €151.1 million.
Amundi Funds:
- Pioneer Global Equity A EUR (C), 1.93% + performance fee, €135.4m.
C-QUADRAT:
- ARTS Total Return Global AMI, 2.49% + performance fee, €72.5m.
ČSOB Asset Management:
- Rastový, 2.29%, €81.8m.
Eurizon Asset Management Slovakia:
- Akciové portfólio, 1.49%, €407.6m,
- Flexibilný konzervatívny, 1.43% + performance fee, EUR 71.0 million,
- Dynamické portfólio, 1.73%, €478.9m,
- Active Magnifica, 1.56%, 122.7 million euro,
- Active Bond, 1.46% + performance fee, EUR 93.0 million.
Eurizon Capital:
- Manager Selection Fund - MS 70 R, 2.24%, €129.6m,
- Eurizon Fund Equity Innovation R, 2.31% + performance fee, €108.6m.
IAD Investments:
- Global Index, 3.86%, €131.6m.
Tatra Asset Management:
- Globálny akciový fond, 1.29%, €99.4m,
- Dlhopisový fond, 0.91%, EUR 215.4 million
- Private Growth 1, 1.87%, EUR 164.6 million,
- Smart Fund, 1.62%, €150.1 million,
- Private Growth, 1.73%, EUR 129.2 million,
- Balanced Fund, 1.51%, EUR 171.1 million.
UNIQA Investment Company:
- Selection Global Equity, 1.82%, EUR 74.0 million.


